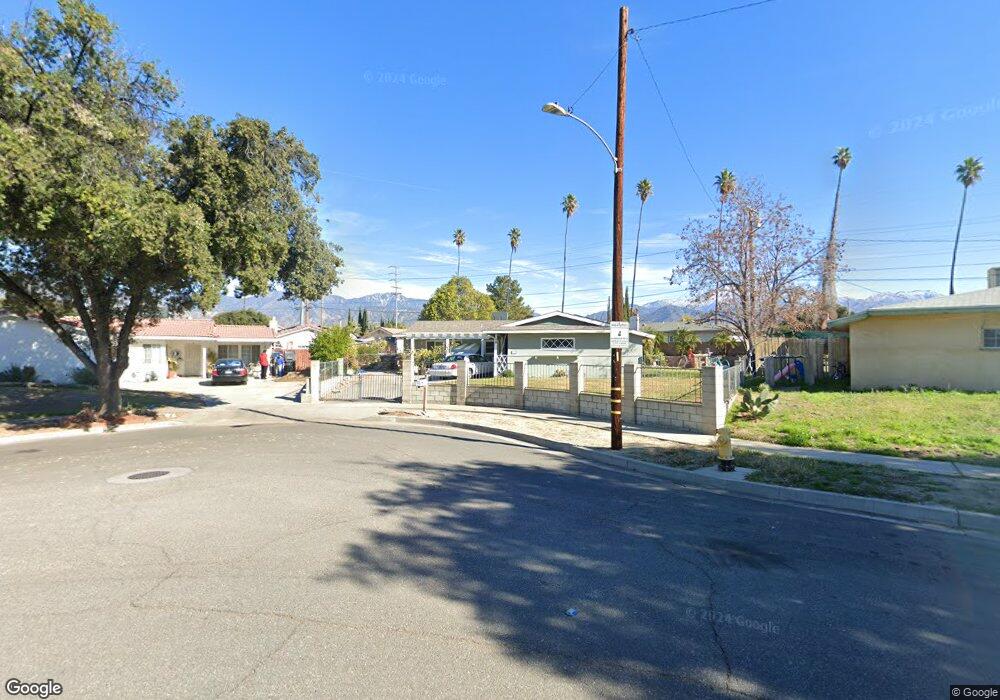
753 Mulvihill Ave Redlands, CA 92374
North Redlands NeighborhoodEstimated Value: $427,000 - $574,000
4
Beds
2
Baths
1,228
Sq Ft
$415/Sq Ft
Est. Value
About This Home
This home is located at 753 Mulvihill Ave, Redlands, CA 92374 and is currently estimated at $509,068, approximately $414 per square foot. 753 Mulvihill Ave is a home located in San Bernardino County with nearby schools including Lugonia Elementary School, Clement Middle School, and Citrus Valley High School.
Ownership History
Date
Name
Owned For
Owner Type
Purchase Details
Closed on
Sep 10, 2018
Sold by
Nabors Jeffrey Jabe and Jones Brigitte B
Bought by
Jones Brigitte B
Current Estimated Value
Home Financials for this Owner
Home Financials are based on the most recent Mortgage that was taken out on this home.
Original Mortgage
$192,500
Outstanding Balance
$167,526
Interest Rate
4.5%
Mortgage Type
New Conventional
Estimated Equity
$341,542
Purchase Details
Closed on
Sep 5, 2012
Sold by
Nabors Jeff
Bought by
Nabors Jeffery Jabe and Jones Brigitte B
Purchase Details
Closed on
Jan 7, 2009
Sold by
Hanson James Michael and Hanson Randolph E
Bought by
Nabors Jeff
Home Financials for this Owner
Home Financials are based on the most recent Mortgage that was taken out on this home.
Original Mortgage
$111,200
Interest Rate
5.14%
Mortgage Type
Purchase Money Mortgage
Purchase Details
Closed on
Apr 3, 2001
Sold by
Hanson Roszella
Bought by
Hanson Roszella M and The Roszella M Hanson Trust
Create a Home Valuation Report for This Property
The Home Valuation Report is an in-depth analysis detailing your home's value as well as a comparison with similar homes in the area
Home Values in the Area
Average Home Value in this Area
Purchase History
| Date | Buyer | Sale Price | Title Company |
|---|---|---|---|
| Jones Brigitte B | $137,500 | Title365 | |
| Nabors Jeffery Jabe | -- | None Available | |
| Nabors Jeff | $139,000 | Southland Title Of Sbernardi | |
| Hanson Roszella M | -- | -- |
Source: Public Records
Mortgage History
| Date | Status | Borrower | Loan Amount |
|---|---|---|---|
| Open | Jones Brigitte B | $192,500 | |
| Previous Owner | Nabors Jeff | $111,200 |
Source: Public Records
Tax History
| Year | Tax Paid | Tax Assessment Tax Assessment Total Assessment is a certain percentage of the fair market value that is determined by local assessors to be the total taxable value of land and additions on the property. | Land | Improvement |
|---|---|---|---|---|
| 2025 | $4,365 | $356,966 | $107,090 | $249,876 |
| 2024 | $4,074 | $349,966 | $104,990 | $244,976 |
| 2023 | $4,068 | $343,104 | $102,931 | $240,173 |
| 2022 | $4,008 | $336,377 | $100,913 | $235,464 |
| 2021 | $4,079 | $329,781 | $98,934 | $230,847 |
| 2020 | $4,018 | $326,400 | $97,920 | $228,480 |
| 2019 | $3,904 | $320,000 | $96,000 | $224,000 |
| 2018 | $1,888 | $157,314 | $47,193 | $110,121 |
| 2017 | $1,871 | $154,230 | $46,268 | $107,962 |
| 2016 | $1,848 | $151,206 | $45,361 | $105,845 |
| 2015 | $1,833 | $148,935 | $44,680 | $104,255 |
| 2014 | $1,799 | $146,018 | $43,805 | $102,213 |
Source: Public Records
Map
Nearby Homes
- 824 Hartzell Ave
- 1602 Glover St
- 1076 Occidental Cir
- 1808 Cave St
- 122 E Pioneer Ave
- 1543 Hanford St
- 140 W Pioneer Ave Unit 100
- 140 W Pioneer Ave Unit 95
- 1230 Cantania Dr
- 610 E Lugonia Ave Unit 4
- 1423 Century St
- 1237 Sherry Way
- 1038 Sandalwood Ave
- 1331 Century St
- 1300 E Pioneer Ave
- 853 Railway Ln
- 873 Railway Ln
- 848 Railway Ln
- 1305 E San Bernardino Ave
- 1251 E Lugonia Ave Unit 48
- 749 Mulvihill Ave
- 757 Mulvihill Ave
- 1721 Church St
- 1725 Church St
- 1717 Church St
- 745 Mulvihill Ave
- 754 E Pioneer Ave
- 750 E Pioneer Ave
- 761 Mulvihill Ave
- 1713 Church St
- 746 E Pioneer Ave
- 758 E Pioneer Ave
- 750 Mulvihill Ave
- 641 Mulvihill Ave
- 642 E Pioneer Ave
- 765 Mulvihill Ave
- 760 Mulvihill Ave
- 1709 Church St
- 807 Frontier Ave
- 1730 Church St
Your Personal Tour Guide
Ask me questions while you tour the home.