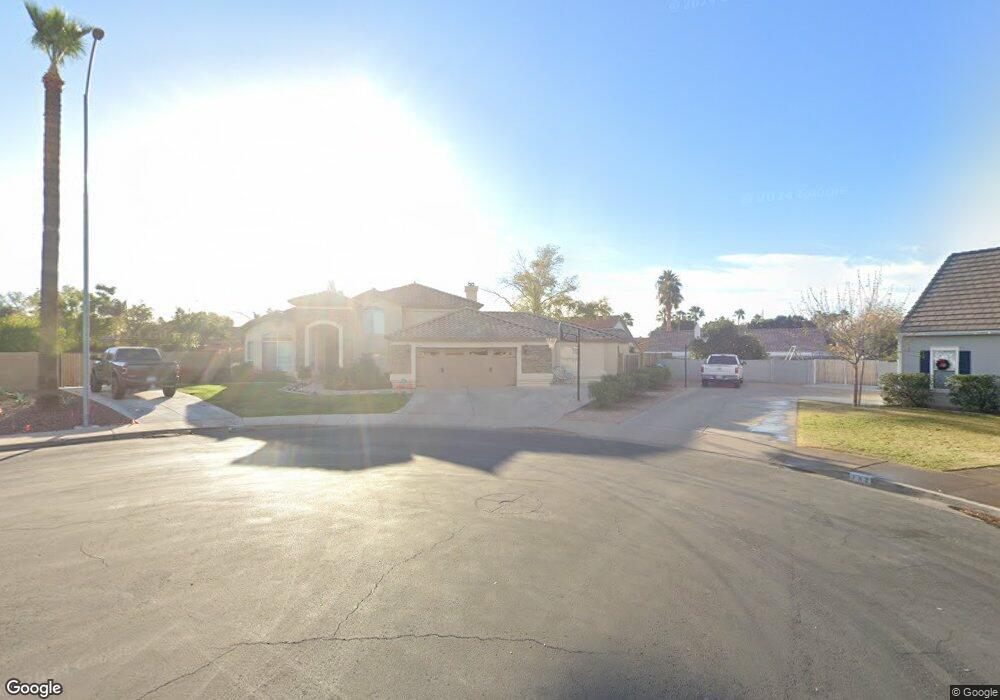
753 N 39th Cir Mesa, AZ 85205
The Groves NeighborhoodEstimated Value: $707,388 - $770,000
--
Bed
4
Baths
2,779
Sq Ft
$269/Sq Ft
Est. Value
About This Home
This home is located at 753 N 39th Cir, Mesa, AZ 85205 and is currently estimated at $746,847, approximately $268 per square foot. 753 N 39th Cir is a home located in Maricopa County with nearby schools including Entz Elementary School, Franklin at Brimhall Elementary School, and Franklin West Elementary School.
Ownership History
Date
Name
Owned For
Owner Type
Purchase Details
Closed on
Jul 21, 2020
Sold by
Sweeney Douglas A and Sweeney Kristen R
Bought by
Spahr Austin and Mackey Nicole Sarah
Current Estimated Value
Home Financials for this Owner
Home Financials are based on the most recent Mortgage that was taken out on this home.
Original Mortgage
$408,000
Outstanding Balance
$362,459
Interest Rate
3.2%
Mortgage Type
New Conventional
Estimated Equity
$384,388
Purchase Details
Closed on
Nov 29, 2017
Sold by
Sweeney Douglas A
Bought by
Sweeney Douglas A and Sweeney Kristen R
Create a Home Valuation Report for This Property
The Home Valuation Report is an in-depth analysis detailing your home's value as well as a comparison with similar homes in the area
Home Values in the Area
Average Home Value in this Area
Purchase History
| Date | Buyer | Sale Price | Title Company |
|---|---|---|---|
| Spahr Austin | $520,000 | Chicago Title Agency | |
| Sweeney Douglas A | -- | None Available |
Source: Public Records
Mortgage History
| Date | Status | Borrower | Loan Amount |
|---|---|---|---|
| Open | Spahr Austin | $408,000 |
Source: Public Records
Tax History Compared to Growth
Tax History
| Year | Tax Paid | Tax Assessment Tax Assessment Total Assessment is a certain percentage of the fair market value that is determined by local assessors to be the total taxable value of land and additions on the property. | Land | Improvement |
|---|---|---|---|---|
| 2025 | $3,025 | $35,558 | -- | -- |
| 2024 | $3,057 | $33,865 | -- | -- |
| 2023 | $3,057 | $53,220 | $10,640 | $42,580 |
| 2022 | $2,992 | $39,250 | $7,850 | $31,400 |
| 2021 | $3,060 | $38,400 | $7,680 | $30,720 |
| 2020 | $3,017 | $36,070 | $7,210 | $28,860 |
| 2019 | $2,800 | $34,280 | $6,850 | $27,430 |
| 2018 | $2,670 | $32,130 | $6,420 | $25,710 |
| 2017 | $2,588 | $30,570 | $6,110 | $24,460 |
| 2016 | $2,540 | $31,560 | $6,310 | $25,250 |
| 2015 | $2,395 | $30,560 | $6,110 | $24,450 |
Source: Public Records
Map
Nearby Homes
- 3920 E Ellis St
- 3930 E Enrose St
- 625 N 38th St
- 4037 E Elmwood St
- 3620 E Dover St
- 526 N Merino
- 4126 E Covina St
- 3931 E Fox Cir
- 525 N Val Vista Dr Unit 21
- 3716 E University Dr Unit 2030
- 3716 E University Dr Unit 2014
- 3716 E University Dr Unit C2010
- 3727 E Fargo St
- 4258 E Decatur St
- 3753 E Fairbrook St
- 3464 E Decatur St
- 4065 E University Dr Unit 261
- 4065 E University Dr Unit 157
- 523 N Omaha Cir
- 3508 E Encanto St
- 3916 E Dartmouth St
- 761 N 39th Way
- 742 N 39th Way
- 750 N 39th Way
- 3924 E Dartmouth St
- 752 N 39th Way
- 3908 E Dartmouth St
- 758 N 39th Way
- 3932 E Dartmouth St
- 3866 E Dartmouth St
- 760 N 39th Cir
- 735 N Maple Cir
- 3858 E Dartmouth St
- 3915 E Dartmouth St
- 3923 E Dartmouth St
- 747 N 39th Way
- 3865 E Adobe St
- 3907 E Dartmouth St
- 739 N 39th Way
- 743 N Maple Cir