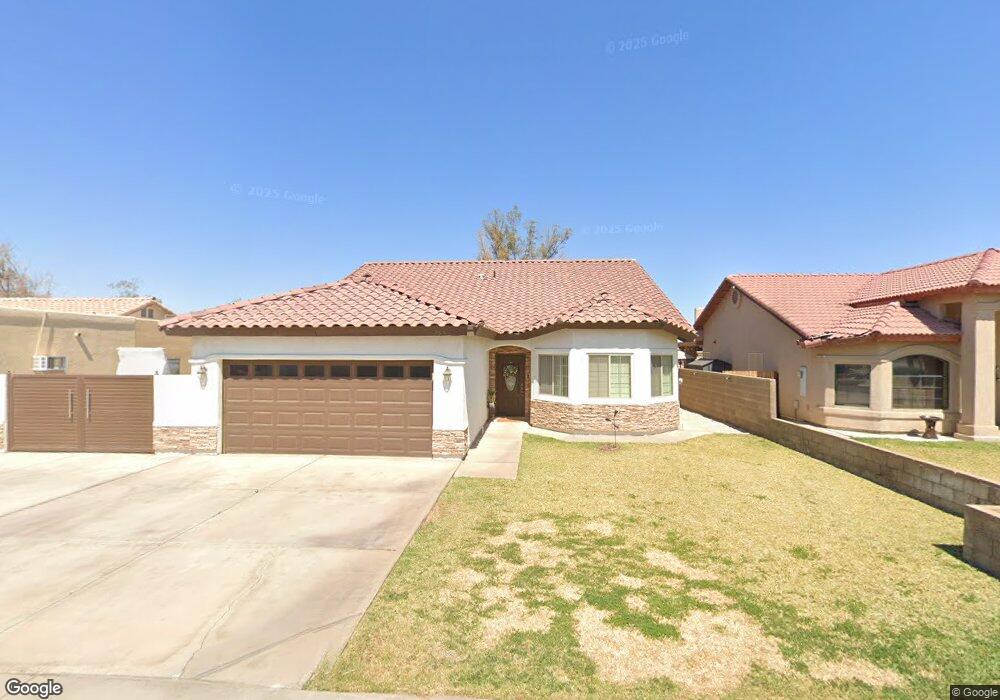
753 N Marshall Loop Rd Somerton, AZ 85350
Estimated Value: $284,000 - $322,000
3
Beds
2
Baths
1,586
Sq Ft
$189/Sq Ft
Est. Value
About This Home
This home is located at 753 N Marshall Loop Rd, Somerton, AZ 85350 and is currently estimated at $300,356, approximately $189 per square foot. 753 N Marshall Loop Rd is a home located in Yuma County with nearby schools including Orange Grove Elementary School, Somerton Middle School, and Kofa High School.
Ownership History
Date
Name
Owned For
Owner Type
Purchase Details
Closed on
Nov 22, 2020
Sold by
Mueller Scott and Mueller Dubia
Bought by
Carlos Raul and Martinez Rosaura
Current Estimated Value
Home Financials for this Owner
Home Financials are based on the most recent Mortgage that was taken out on this home.
Original Mortgage
$156,565
Outstanding Balance
$137,450
Interest Rate
2.7%
Mortgage Type
New Conventional
Estimated Equity
$162,906
Purchase Details
Closed on
Mar 2, 2004
Sold by
Kdc Partners Inc
Bought by
Mueller Scott and Mueller Dubia
Home Financials for this Owner
Home Financials are based on the most recent Mortgage that was taken out on this home.
Original Mortgage
$129,845
Interest Rate
6.27%
Mortgage Type
VA
Purchase Details
Closed on
Feb 13, 2004
Sold by
Sawyer Dean D and Sawyer Edna
Bought by
Kdc Partners Inc
Home Financials for this Owner
Home Financials are based on the most recent Mortgage that was taken out on this home.
Original Mortgage
$129,845
Interest Rate
6.27%
Mortgage Type
VA
Create a Home Valuation Report for This Property
The Home Valuation Report is an in-depth analysis detailing your home's value as well as a comparison with similar homes in the area
Home Values in the Area
Average Home Value in this Area
Purchase History
| Date | Buyer | Sale Price | Title Company |
|---|---|---|---|
| Carlos Raul | $155,000 | Stewart Ttl & Tr Of Phoenix | |
| Mueller Scott | $129,845 | Citizens Title | |
| Kdc Partners Inc | $31,500 | Citizens Title |
Source: Public Records
Mortgage History
| Date | Status | Borrower | Loan Amount |
|---|---|---|---|
| Open | Carlos Raul | $156,565 | |
| Previous Owner | Mueller Scott | $129,845 |
Source: Public Records
Tax History
| Year | Tax Paid | Tax Assessment Tax Assessment Total Assessment is a certain percentage of the fair market value that is determined by local assessors to be the total taxable value of land and additions on the property. | Land | Improvement |
|---|---|---|---|---|
| 2026 | $1,516 | $14,300 | $2,481 | $11,819 |
| 2025 | $1,497 | $13,619 | $2,335 | $11,284 |
| 2024 | $1,437 | $12,970 | $2,356 | $10,614 |
| 2023 | $1,437 | $12,353 | $2,262 | $10,091 |
| 2022 | $1,520 | $11,765 | $2,602 | $9,163 |
| 2021 | $1,466 | $11,204 | $2,644 | $8,560 |
| 2020 | $1,648 | $10,671 | $2,884 | $7,787 |
| 2019 | $1,549 | $10,162 | $2,200 | $7,962 |
| 2018 | $1,502 | $9,679 | $2,252 | $7,427 |
| 2017 | $1,470 | $9,679 | $2,252 | $7,427 |
| 2016 | $1,379 | $8,779 | $2,364 | $6,415 |
| 2015 | $1,363 | $8,361 | $1,950 | $6,411 |
| 2014 | $1,363 | $10,060 | $2,550 | $7,510 |
Source: Public Records
Map
Nearby Homes
- 710 N Marshall Loop Rd
- 723 N Musgrove Ave
- 1180 N Daniela Ave
- 696 S Dalton Ave
- 866 Palo Verde St
- 650 W Orchid St
- 1530 N Daniela Ave
- 1520 Jennifer Ave
- 671 S Bingham Ave
- 698 S Columbia Ave
- 816 W Spring St
- 843 W Spring St
- 844 W Main St
- 325 Toro Ave
- 712 E 12th Place
- 676 E 12th Place
- 569 W Ramona St
- 207 E 12th Place
- 153 E 12th Place
- 263 E 13th St
- 761 N Marshall Loop Rd
- 745 N Marshall Loop Rd
- 739 N Marshall Loop Rd
- 773 N Marshall Loop Rd
- 752 N Marshall Loop Rd
- 752 N Marshall Loop Rd
- 766 N Marshall Loop Rd
- 795 N Marshall Loop Rd
- 744 N Marshall Loop Rd
- 733 N Marshall Loop Rd
- 799 N Marshall Loop Rd
- 725 N Bingham Ave
- 730 N Marshall Loop Rd
- 721 N Marshall Loop Rd
- 690 N Bingham Ave Unit M
- 690 N Bingham Ave
- 690 N Bingham Ave
- 690 N Bingham Ave
- 690 N Bingham Ave
- 690 N Bingham Ave
Your Personal Tour Guide
Ask me questions while you tour the home.