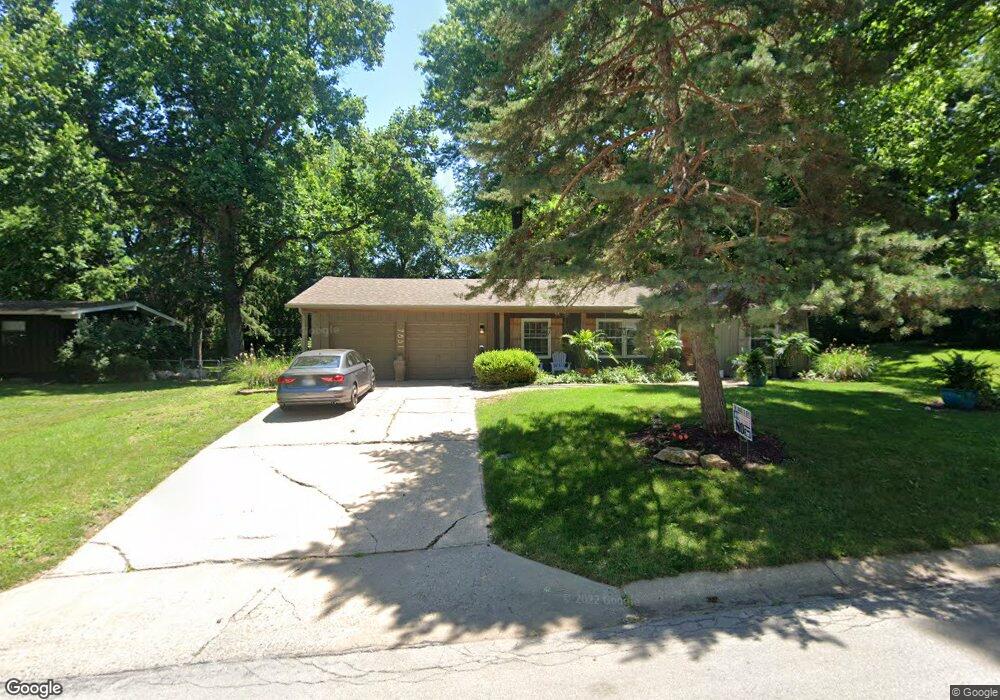
7531 Reinhardt Dr Prairie Village, KS 66208
Estimated Value: $336,000 - $395,163
2
Beds
1
Bath
1,034
Sq Ft
$353/Sq Ft
Est. Value
About This Home
This home is located at 7531 Reinhardt Dr, Prairie Village, KS 66208 and is currently estimated at $364,791, approximately $352 per square foot. 7531 Reinhardt Dr is a home located in Johnson County with nearby schools including Belinder Elementary School, Indian Hills Middle School, and Shawnee Mission East High School.
Ownership History
Date
Name
Owned For
Owner Type
Purchase Details
Closed on
Sep 14, 2011
Sold by
Webster Tina M
Bought by
Thomas Steve
Current Estimated Value
Home Financials for this Owner
Home Financials are based on the most recent Mortgage that was taken out on this home.
Original Mortgage
$123,780
Outstanding Balance
$82,671
Interest Rate
3.75%
Mortgage Type
FHA
Estimated Equity
$282,120
Purchase Details
Closed on
Jan 9, 2003
Sold by
Ray Elise
Bought by
Ray Ii Richard R and The Richard R Ray Ii Trust
Purchase Details
Closed on
Jan 8, 2003
Sold by
Ray Richard R
Bought by
Ray Ii Richard R and The Richard R Ray Ii Trust
Purchase Details
Closed on
Oct 13, 2001
Sold by
Millard Brad Scott and Millard Sheri L
Bought by
Webster Tina M
Home Financials for this Owner
Home Financials are based on the most recent Mortgage that was taken out on this home.
Original Mortgage
$123,050
Interest Rate
6.62%
Create a Home Valuation Report for This Property
The Home Valuation Report is an in-depth analysis detailing your home's value as well as a comparison with similar homes in the area
Home Values in the Area
Average Home Value in this Area
Purchase History
| Date | Buyer | Sale Price | Title Company |
|---|---|---|---|
| Thomas Steve | -- | Homestead Title | |
| Ray Ii Richard R | -- | -- | |
| Ray Ii Richard R | -- | -- | |
| Webster Tina M | -- | Guarantee Title |
Source: Public Records
Mortgage History
| Date | Status | Borrower | Loan Amount |
|---|---|---|---|
| Open | Thomas Steve | $123,780 | |
| Previous Owner | Webster Tina M | $123,050 |
Source: Public Records
Tax History Compared to Growth
Tax History
| Year | Tax Paid | Tax Assessment Tax Assessment Total Assessment is a certain percentage of the fair market value that is determined by local assessors to be the total taxable value of land and additions on the property. | Land | Improvement |
|---|---|---|---|---|
| 2024 | $4,308 | $36,432 | $22,131 | $14,301 |
| 2023 | $4,265 | $35,512 | $21,069 | $14,443 |
| 2022 | $3,905 | $32,350 | $18,323 | $14,027 |
| 2021 | $3,717 | $29,130 | $18,323 | $10,807 |
| 2020 | $3,263 | $25,059 | $16,657 | $8,402 |
| 2019 | $3,033 | $22,954 | $13,875 | $9,079 |
| 2018 | $2,828 | $21,344 | $13,216 | $8,128 |
| 2017 | $2,259 | $16,491 | $10,159 | $6,332 |
| 2016 | $2,176 | $15,594 | $7,815 | $7,779 |
| 2015 | $2,120 | $15,399 | $7,817 | $7,582 |
| 2013 | -- | $14,605 | $6,792 | $7,813 |
Source: Public Records
Map
Nearby Homes
- 3316 W 75th St
- 3619 W 75th St
- 7529 Mohawk Dr
- 3523 W 74th St
- 7400 Canterbury St
- 7615 Mission Rd
- 7740 Chadwick St
- 7607 Fairway St
- 7819 Falmouth St
- 3119 W 72nd Terrace
- 7805 Mission Rd
- 7853 Howe Cir
- 4024 W 73rd St
- 4301 W 74th Terrace
- 3310 W 71st Terrace
- 7412 Delmar St
- 3306 W 71st Terrace
- 3305 W 71st St
- 3405 W 71st St
- 3409 W 71st St
- 7531 Reinhardt St
- 7517 Reinhardt Dr
- 7541 Reinhardt Dr
- 7540 Windsor St
- 7534 Windsor St
- 7534 Reinhardt St
- 7546 Windsor St
- 7534 Reinhardt Dr
- 7530 Reinhardt Dr
- 7530 Windsor St
- 7538 Reinhardt St
- 7601 Reinhardt Dr
- 7540 Reinhardt Dr
- 7550 Windsor St
- 7520 Reinhardt Dr
- 7511 Reinhardt Dr
- 7600 Windsor St
- 7540 Reinhardt St
- 7524 Windsor St
- 7600 Reinhardt Dr