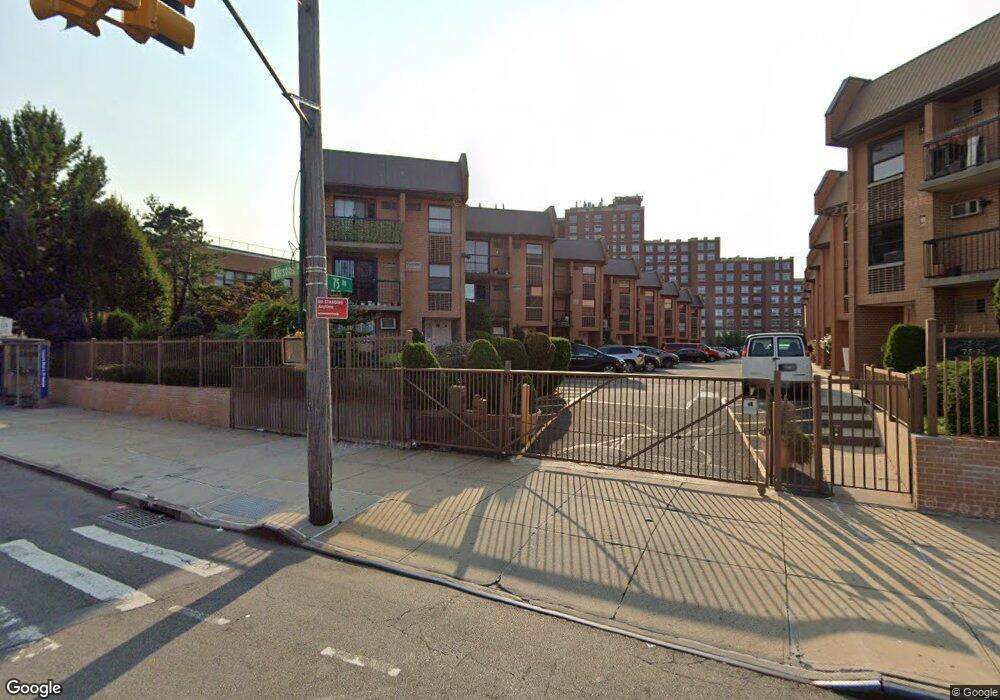
7532 Parsons Blvd Unit G2 Fresh Meadows, NY 11366
Kew Gardens Hills NeighborhoodEstimated Value: $642,673 - $744,000
--
Bed
--
Bath
1,074
Sq Ft
$644/Sq Ft
Est. Value
About This Home
This home is located at 7532 Parsons Blvd Unit G2, Fresh Meadows, NY 11366 and is currently estimated at $691,668, approximately $644 per square foot. 7532 Parsons Blvd Unit G2 is a home located in Queens County with nearby schools including I.S. 250 - The Robert F. Kennedy Community Middle School and Al-Mamoor School.
Ownership History
Date
Name
Owned For
Owner Type
Purchase Details
Closed on
Aug 14, 2001
Sold by
Park Il Yoon
Bought by
Park Il Yoon and Park Mi Hwa
Current Estimated Value
Home Financials for this Owner
Home Financials are based on the most recent Mortgage that was taken out on this home.
Original Mortgage
$100,000
Interest Rate
6.7%
Mortgage Type
Purchase Money Mortgage
Purchase Details
Closed on
Aug 7, 2001
Sold by
Grabovenko Paula A
Bought by
Park Il Yoon
Home Financials for this Owner
Home Financials are based on the most recent Mortgage that was taken out on this home.
Original Mortgage
$100,000
Interest Rate
6.7%
Mortgage Type
Purchase Money Mortgage
Create a Home Valuation Report for This Property
The Home Valuation Report is an in-depth analysis detailing your home's value as well as a comparison with similar homes in the area
Home Values in the Area
Average Home Value in this Area
Purchase History
| Date | Buyer | Sale Price | Title Company |
|---|---|---|---|
| Park Il Yoon | -- | -- | |
| Park Il Yoon | -- | -- |
Source: Public Records
Mortgage History
| Date | Status | Borrower | Loan Amount |
|---|---|---|---|
| Previous Owner | Park Il Yoon | $100,000 |
Source: Public Records
Tax History Compared to Growth
Tax History
| Year | Tax Paid | Tax Assessment Tax Assessment Total Assessment is a certain percentage of the fair market value that is determined by local assessors to be the total taxable value of land and additions on the property. | Land | Improvement |
|---|---|---|---|---|
| 2025 | $1,392 | $21,498 | $311 | $21,187 |
| 2024 | $1,496 | $21,461 | $339 | $21,122 |
| 2023 | $1,345 | $20,999 | $319 | $20,680 |
| 2022 | $612 | $34,304 | $559 | $33,745 |
| 2021 | $1,308 | $33,697 | $559 | $33,138 |
| 2020 | $1,237 | $34,341 | $559 | $33,782 |
| 2019 | $1,212 | $31,146 | $559 | $30,587 |
| 2018 | $1,124 | $17,499 | $369 | $17,130 |
| 2017 | $1,037 | $16,509 | $356 | $16,153 |
| 2016 | $936 | $16,509 | $356 | $16,153 |
| 2015 | $500 | $14,929 | $353 | $14,576 |
| 2014 | $500 | $14,904 | $382 | $14,522 |
Source: Public Records
Map
Nearby Homes
- 75-22 Parsons Blvd Unit D2
- 7548 Parsons Blvd Unit 1C
- 15824 75th Rd
- 15353 77th Ave Unit 3E
- 160-06 75th Rd Fesh Meadow Unit 3
- 153-44 77th Ave
- 158-18 77th Ave
- 7177 159th St Unit 205
- 7177 159th St Unit 3D
- 76-33 160th St
- 160-20 76th Ave
- 153-51 77th Rd
- 15062 77th Ave
- 158-36 77th Rd
- 150-29 72nd Dr Unit 3L
- 150-29 77th Rd
- 150-20 77th Ave
- 77-14 162nd St
- 71-28 Sutton Place Unit 3
- 162-15 77th Ave
- 7532 Parsons Blvd Unit H3
- 7532 Parsons Blvd Unit H2
- 7532 Parsons Blvd Unit H1
- 7532 Parsons Blvd Unit G3
- 7532 Parsons Blvd Unit G1
- 7532 Parsons Blvd Unit F3
- 7532 Parsons Blvd Unit F2
- 7532 Parsons Blvd Unit F1
- 7532 Parsons Blvd Unit E3
- 7532 Parsons Blvd Unit E2
- 7532 Parsons Blvd Unit E1
- 7532 Parsons Blvd Unit D3
- 7532 Parsons Blvd Unit D2
- 7532 Parsons Blvd Unit D1
- 7532 Parsons Blvd Unit C3
- 7532 Parsons Blvd Unit C2
- 7532 Parsons Blvd Unit C1
- 7532 Parsons Blvd Unit B3
- 7532 Parsons Blvd Unit B2
- 7532 Parsons Blvd Unit A3