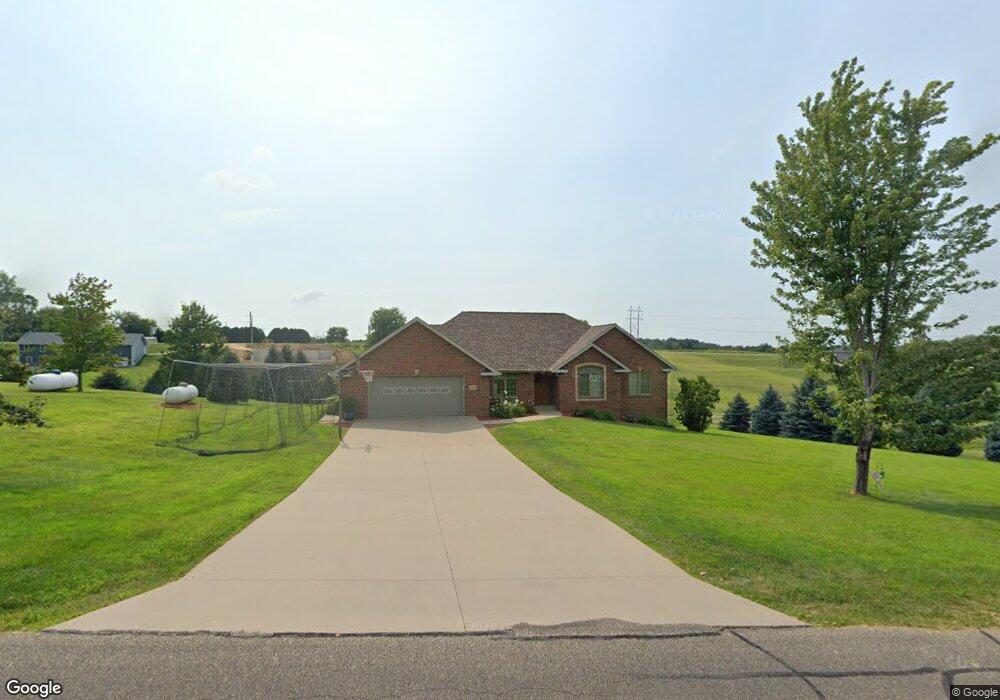
7537 Prairie View Ln Dubuque, IA 52003
Estimated Value: $457,193 - $481,000
3
Beds
4
Baths
1,790
Sq Ft
$262/Sq Ft
Est. Value
About This Home
This home is located at 7537 Prairie View Ln, Dubuque, IA 52003 and is currently estimated at $469,548, approximately $262 per square foot. 7537 Prairie View Ln is a home located in Dubuque County with nearby schools including Table Mound Elementary School, Eleanor Roosevelt Middle School, and Dubuque Senior High School.
Ownership History
Date
Name
Owned For
Owner Type
Purchase Details
Closed on
Apr 22, 2009
Sold by
Busch Richard E and Busch Donna M
Bought by
Ruba Daniel P and Ruba Kellie K
Current Estimated Value
Home Financials for this Owner
Home Financials are based on the most recent Mortgage that was taken out on this home.
Original Mortgage
$241,544
Outstanding Balance
$153,594
Interest Rate
5.05%
Mortgage Type
FHA
Estimated Equity
$315,954
Purchase Details
Closed on
Dec 6, 2006
Sold by
Bechen James M and Bechen Tracy L
Bought by
Busch Richard E and Busch Donna M
Home Financials for this Owner
Home Financials are based on the most recent Mortgage that was taken out on this home.
Original Mortgage
$160,000
Interest Rate
6.33%
Mortgage Type
New Conventional
Create a Home Valuation Report for This Property
The Home Valuation Report is an in-depth analysis detailing your home's value as well as a comparison with similar homes in the area
Home Values in the Area
Average Home Value in this Area
Purchase History
| Date | Buyer | Sale Price | Title Company |
|---|---|---|---|
| Ruba Daniel P | $246,000 | None Available | |
| Busch Richard E | $222,000 | None Available |
Source: Public Records
Mortgage History
| Date | Status | Borrower | Loan Amount |
|---|---|---|---|
| Open | Ruba Daniel P | $241,544 | |
| Previous Owner | Busch Richard E | $160,000 |
Source: Public Records
Tax History Compared to Growth
Tax History
| Year | Tax Paid | Tax Assessment Tax Assessment Total Assessment is a certain percentage of the fair market value that is determined by local assessors to be the total taxable value of land and additions on the property. | Land | Improvement |
|---|---|---|---|---|
| 2025 | $4,072 | $385,100 | $92,500 | $292,600 |
| 2024 | $4,072 | $358,500 | $84,100 | $274,400 |
| 2023 | $3,936 | $358,500 | $84,100 | $274,400 |
| 2022 | $3,840 | $291,480 | $74,500 | $216,980 |
| 2021 | $3,840 | $291,480 | $74,500 | $216,980 |
| 2020 | $4,038 | $285,850 | $71,000 | $214,850 |
| 2019 | $3,750 | $285,850 | $71,000 | $214,850 |
| 2018 | $3,638 | $255,920 | $52,500 | $203,420 |
| 2017 | $3,642 | $254,650 | $52,500 | $202,150 |
| 2016 | $3,540 | $242,550 | $50,000 | $192,550 |
| 2015 | $3,540 | $242,550 | $50,000 | $192,550 |
| 2014 | $3,322 | $236,120 | $47,500 | $188,620 |
Source: Public Records
Map
Nearby Homes
- 0 Olde Davenport Rd Unit 147533
- 8955 Hickory Hollow Ct
- 8906 Pheasant Ln
- 8373 Olde Davenport Rd
- 8643 Silver Oaks Dr
- 8693 Silver Oaks Dr
- 8673 Silver Oaks Dr
- 8682 Silver Oaks Dr
- 8660 Silver Oaks Dr
- 8632 Silver Oaks Dr
- 8622 Silver Oaks Dr
- 8602 Silver Oaks Dr
- 8698 Silver Oaks Dr
- 8629 Silver Oaks Dr
- 8612 Silver Oaks Dr
- 8608 Ebony Dr
- 8638 Abaca Ct
- 8624 Abaca Ct
- 8616 Abaca Ct
- 8602 Abaca Ct
- 7577 Prairie View Ln
- 7509 Prairie View Ln
- 8623 Moonrise Ct
- 7558 Olde Davenport Rd
- 7475 Prairie View Ln
- 7612 Prairie View Ln
- 8619 Moonrise Ct
- 7560 Olde Davenport Rd
- 7500 Olde Davenport Rd
- 7597 Prairie View Ln
- 7452 Olde Davenport Rd
- 7619 Prairie View Ln
- 7630 Prairie View Ln
- 8601 Moonrise Ct
- 7460 Prairie View Ln
- 7451 Prairie View Ln
- 8602 Moonrise Ct
- 7633 Prairie View Ln
- 7652 Prairie View Ln
- 7418 Olde Davenport Rd