754 Front St Woonsocket, RI 02895
Globe District NeighborhoodEstimated Value: $305,071
About This Home
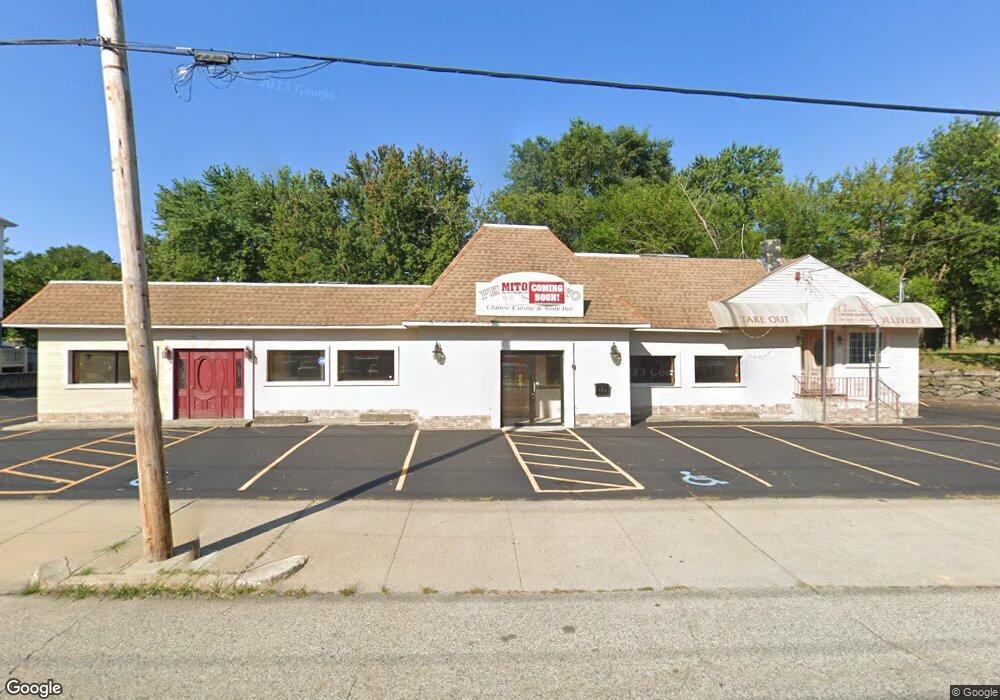
This home is located at 754 Front St, Woonsocket, RI 02895 and is currently priced at $305,071, approximately $169 per square foot. 754 Front St is a home located in Providence County with nearby schools including Woonsocket High School, Founders Academy, and Beacon Charter School.
Ownership History
We collect this data history from publicly available records. To have your information removed, we recommend requesting removal directly through your county’s website.
Purchase Details
Purchase Details
Purchase Details
Purchase Details
Purchase Details
Purchase Details
Home Values in the Area
Average Home Value in this Area
Purchase History
We collect this data history from publicly available records. To have your information removed, we recommend requesting removal directly through your county’s website.
| Date | Buyer | Sale Price | Title Company |
|---|---|---|---|
| $9,616 | -- | ||
| $9,616 | -- | ||
| $130,000 | -- | ||
| $130,000 | -- | ||
| $110,000 | -- | ||
| $200,000 | -- | ||
| $200,000 | -- | ||
| $200,000 | -- | ||
| $200,000 | -- | ||
| $200,000 | -- | ||
| $200,000 | -- | ||
| $200,000 | -- | ||
| $200,000 | -- |
Mortgage History
We collect this data history from publicly available records. To have your information removed, we recommend requesting removal directly through your county’s website.
| Date | Status | Borrower | Loan Amount |
|---|---|---|---|
| Previous Owner | $40,000 | ||
| Previous Owner | $250,000 |
Tax History
We collect this data history from publicly available records. To have your information removed, we recommend requesting removal directly through your county’s website.
| Year | Tax Paid | Tax Assessment Tax Assessment Total Assessment is a certain percentage of the fair market value that is determined by local assessors to be the total taxable value of land and additions on the property. | Land | Improvement |
|---|---|---|---|---|
| 2025 | $7,796 | $366,000 | $64,400 | $301,600 |
| 2024 | $8,213 | $304,400 | $53,200 | $251,200 |
| 2023 | $7,896 | $304,400 | $53,200 | $251,200 |
| 2022 | $7,896 | $304,400 | $53,200 | $251,200 |
| 2021 | $10,050 | $289,200 | $44,600 | $244,600 |
| 2020 | $10,191 | $289,200 | $44,600 | $244,600 |
| 2018 | $10,466 | $289,200 | $44,600 | $244,600 |
| 2017 | $7,375 | $199,700 | $46,500 | $153,200 |
| 2016 | $7,656 | $199,700 | $46,500 | $153,200 |
| 2015 | $8,128 | $199,700 | $46,500 | $153,200 |
| 2014 | $6,666 | $166,700 | $51,700 | $115,000 |
Map
- 20 New St
- 651 Front St
- 33 Pleasant St
- 120 East St
- 108 East St
- 122 Grand St
- 36 Pine St
- 104 Jenckes St
- 190 Coe St
- 148 Bernon St Unit 14
- 148 Bernon St Unit 7
- 63 Blakeley St Unit 107
- 99 Allen St Unit 105
- 271 Coe St
- 16 Canal St
- 184 Avenue C Unit 3
- 184 Avenue C Unit 1
- 184 Avenue C Unit 2
- 471 Providence St
- 180 Allen St Unit 104
- 59 New St
- 24 New St
- 71 New St
- 85 New St
- 726 Front St
- 9 New St
- 28 New St
- 716 Front St
- 68 Lincoln St Unit 2
- 60 Lincoln St Unit 68
- 38 Lincoln St
- 6 New St
- 706 Front St Unit 1R
- 74 Lincoln St
- 708 Front St Unit 2F
- 26 Lincoln St Unit 28
- 75 Lincoln St
- 102 Lincoln St
- 41 Lincoln St Unit 45
- 53 Lincoln St Unit 61
Ask me questions while you tour the home.