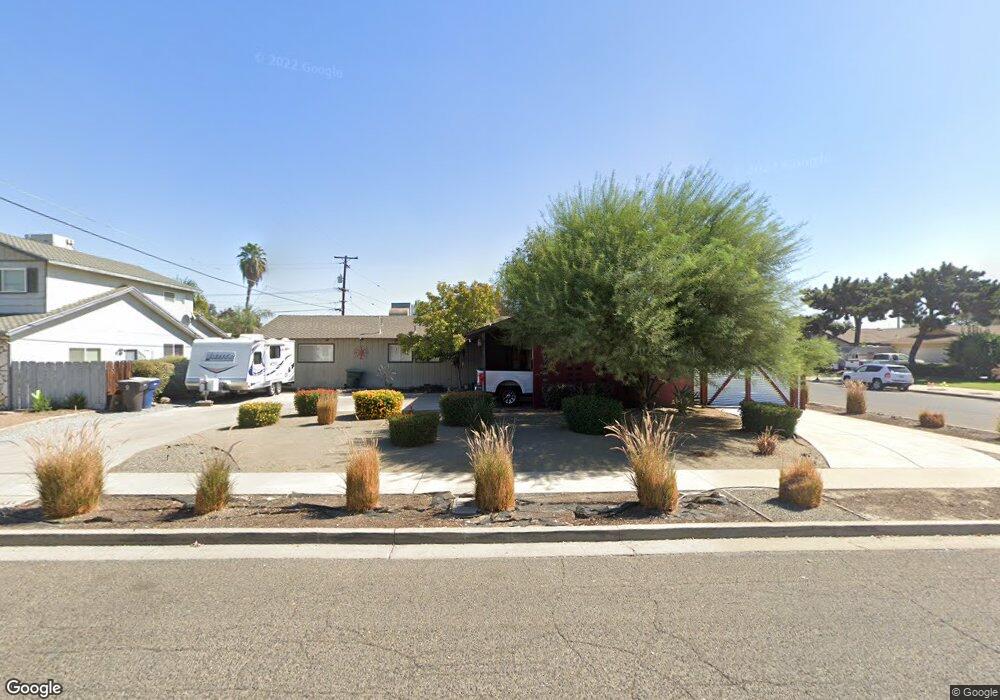
754 N Terrace Park St Tulare, CA 93274
Northeast Tulare NeighborhoodEstimated Value: $350,000 - $397,000
3
Beds
2
Baths
2,106
Sq Ft
$176/Sq Ft
Est. Value
About This Home
This home is located at 754 N Terrace Park St, Tulare, CA 93274 and is currently estimated at $370,215, approximately $175 per square foot. 754 N Terrace Park St is a home located in Tulare County with nearby schools including Garden Elementary School, Cherry Avenue Middle School, and Tulare Western High School.
Ownership History
Date
Name
Owned For
Owner Type
Purchase Details
Closed on
Jan 26, 2017
Sold by
Bailey Amy R
Bought by
Bailey Amy R
Current Estimated Value
Home Financials for this Owner
Home Financials are based on the most recent Mortgage that was taken out on this home.
Original Mortgage
$136,500
Outstanding Balance
$113,331
Interest Rate
4.3%
Mortgage Type
New Conventional
Estimated Equity
$256,884
Purchase Details
Closed on
Sep 30, 2011
Sold by
Mcgrew Ann Louise
Bought by
Pohl Amy R and Bailey Justin M
Home Financials for this Owner
Home Financials are based on the most recent Mortgage that was taken out on this home.
Original Mortgage
$130,456
Interest Rate
4.25%
Mortgage Type
FHA
Purchase Details
Closed on
May 4, 2011
Sold by
Mcgrew Ann Louise
Bought by
Mcgrew Ann Louise and 2000 Ann Louise Mcgrew Trust
Purchase Details
Closed on
Oct 26, 2006
Sold by
Lorenzo Belmida V
Bought by
Lorenzo Belmida and Belmida V Lorenzo Personal Revocable Tru
Create a Home Valuation Report for This Property
The Home Valuation Report is an in-depth analysis detailing your home's value as well as a comparison with similar homes in the area
Home Values in the Area
Average Home Value in this Area
Purchase History
| Date | Buyer | Sale Price | Title Company |
|---|---|---|---|
| Bailey Amy R | -- | Fidelity Title Co | |
| Pohl Amy R | $134,000 | Chicago Title Company | |
| Mcgrew Ann Louise | -- | None Available | |
| Lorenzo Belmida | -- | None Available |
Source: Public Records
Mortgage History
| Date | Status | Borrower | Loan Amount |
|---|---|---|---|
| Open | Bailey Amy R | $136,500 | |
| Closed | Pohl Amy R | $130,456 |
Source: Public Records
Tax History Compared to Growth
Tax History
| Year | Tax Paid | Tax Assessment Tax Assessment Total Assessment is a certain percentage of the fair market value that is determined by local assessors to be the total taxable value of land and additions on the property. | Land | Improvement |
|---|---|---|---|---|
| 2025 | $1,829 | $168,059 | $37,680 | $130,379 |
| 2024 | $1,829 | $164,765 | $36,942 | $127,823 |
| 2023 | $1,783 | $161,535 | $36,218 | $125,317 |
| 2022 | $1,731 | $158,368 | $35,508 | $122,860 |
| 2021 | $1,708 | $155,263 | $34,812 | $120,451 |
| 2020 | $1,737 | $153,671 | $34,455 | $119,216 |
| 2019 | $1,781 | $150,657 | $33,779 | $116,878 |
| 2018 | $1,752 | $147,703 | $33,117 | $114,586 |
| 2017 | $1,736 | $144,807 | $32,468 | $112,339 |
| 2016 | $1,660 | $141,967 | $31,831 | $110,136 |
| 2015 | $1,604 | $139,835 | $31,353 | $108,482 |
| 2014 | $1,604 | $137,096 | $30,739 | $106,357 |
Source: Public Records
Map
Nearby Homes
- 855 E Pleasant Ave
- 629 N Gem St
- 642 N Manor St
- 650 N N Place
- 0 N Cherry St Unit 234532
- 0 N Cherry St Unit 234531
- 530 E Estate Dr
- 1282 E Ben Franklin Ave
- 539 N M St
- 2012 Diamante Dr
- 1280 E Richard Smith Ave
- 861 E Sycamore Ave
- 1145 N M St
- 815 E Sycamore Ave
- 3044 Isleworth Ave Unit 538 Sft
- 708 E Tulare Ave
- 602 N Barranca Ct
- 149 S Salida Place
- 288 E Berkeley Ave
- 202 N L St
- 766 N Terrace Park St
- 862 E Pleasant Ave
- 782 N Terrace Park St
- 767 N Mahaleb St
- 847 E Pleasant Ave
- 839 E Pleasant Ave
- 755 N Terrace Park St
- 767 N Terrace Park St
- 833 E Pleasant Ave
- 783 N Mahaleb St
- 783 N Terrace Park St
- 863 E Pleasant Ave
- 821 E Pleasant Ave
- 801 N Mahaleb St
- 848 E Lyndale Ave
- 846 E Lyndale Ave
- 832 E Lyndale Dr
- 656 N Cherry St
- 801 N Terrace Park St
- 856 E Lyndale Ave