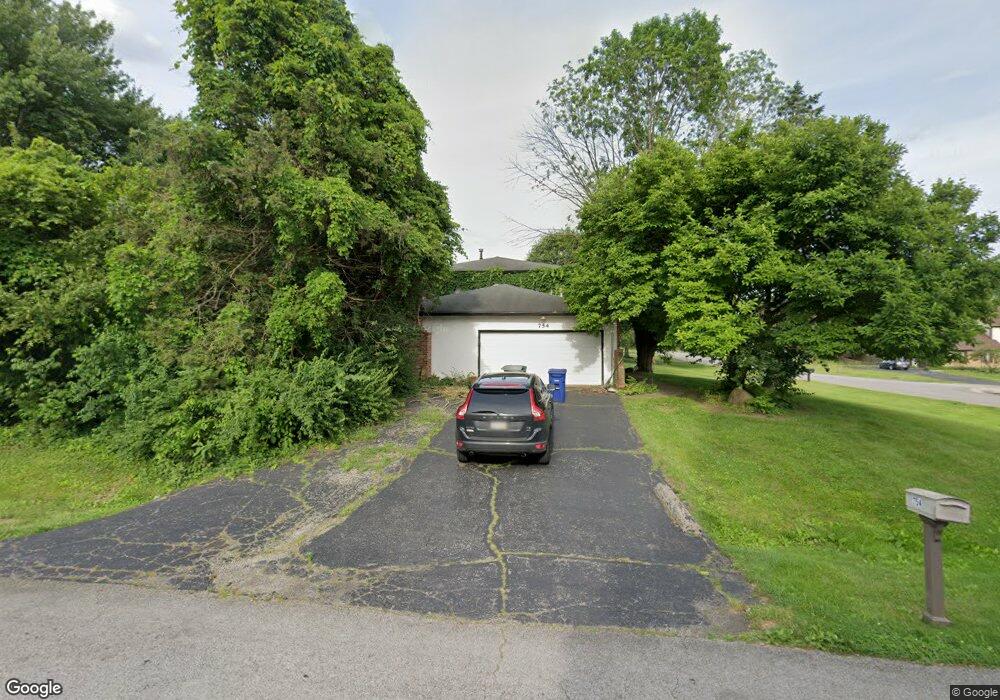
754 Olde Orchard Ct Columbus, OH 43213
Olde Orchard NeighborhoodEstimated Value: $304,000 - $428,000
4
Beds
3
Baths
2,122
Sq Ft
$167/Sq Ft
Est. Value
About This Home
This home is located at 754 Olde Orchard Ct, Columbus, OH 43213 and is currently estimated at $355,380, approximately $167 per square foot. 754 Olde Orchard Ct is a home located in Franklin County with nearby schools including Olde Orchard Elementary School, Sherwood Middle School, and Walnut Ridge High School.
Ownership History
Date
Name
Owned For
Owner Type
Purchase Details
Closed on
Mar 22, 2002
Sold by
Simmons Julian and Saint Julian
Bought by
Davis Michael S and White Davis Anne M
Current Estimated Value
Home Financials for this Owner
Home Financials are based on the most recent Mortgage that was taken out on this home.
Original Mortgage
$163,567
Outstanding Balance
$64,919
Interest Rate
6.93%
Mortgage Type
FHA
Estimated Equity
$290,461
Purchase Details
Closed on
Jan 5, 2001
Sold by
Simmons Saint Julian
Bought by
Simmons Julian and Simmons Vanessa V
Home Financials for this Owner
Home Financials are based on the most recent Mortgage that was taken out on this home.
Original Mortgage
$132,800
Interest Rate
7.69%
Purchase Details
Closed on
Mar 31, 1992
Bought by
Simmons Saint Julian
Purchase Details
Closed on
Mar 1, 1986
Purchase Details
Closed on
Aug 1, 1980
Create a Home Valuation Report for This Property
The Home Valuation Report is an in-depth analysis detailing your home's value as well as a comparison with similar homes in the area
Home Values in the Area
Average Home Value in this Area
Purchase History
| Date | Buyer | Sale Price | Title Company |
|---|---|---|---|
| Davis Michael S | $164,900 | Foundation Title Agency Inc | |
| Simmons Julian | -- | -- | |
| Simmons Saint Julian | $117,400 | -- | |
| -- | $96,700 | -- | |
| -- | $88,000 | -- |
Source: Public Records
Mortgage History
| Date | Status | Borrower | Loan Amount |
|---|---|---|---|
| Open | Davis Michael S | $163,567 | |
| Closed | Simmons Julian | $132,800 |
Source: Public Records
Tax History
| Year | Tax Paid | Tax Assessment Tax Assessment Total Assessment is a certain percentage of the fair market value that is determined by local assessors to be the total taxable value of land and additions on the property. | Land | Improvement |
|---|---|---|---|---|
| 2025 | $4,859 | $102,940 | $30,420 | $72,520 |
| 2024 | $4,859 | $102,940 | $30,420 | $72,520 |
| 2023 | $4,743 | $102,935 | $30,415 | $72,520 |
| 2022 | $3,856 | $70,180 | $34,790 | $35,390 |
| 2021 | $3,767 | $70,180 | $34,790 | $35,390 |
| 2020 | $3,858 | $70,180 | $34,790 | $35,390 |
| 2019 | $3,801 | $60,660 | $30,240 | $30,420 |
| 2018 | $3,661 | $60,660 | $30,240 | $30,420 |
| 2017 | $3,838 | $60,660 | $30,240 | $30,420 |
| 2016 | $4,205 | $58,030 | $9,660 | $48,370 |
| 2015 | $3,490 | $58,030 | $9,660 | $48,370 |
| 2014 | $3,498 | $58,030 | $9,660 | $48,370 |
| 2013 | $1,643 | $55,265 | $9,205 | $46,060 |
Source: Public Records
Map
Nearby Homes
- 787 Persimmon Place
- 6279 Braiden Ct Unit 10B
- 541 Woodingham Place Unit 2-C
- Oxford Plan at Icon Villas at McNaughten
- Ashton Plan at Icon Villas at McNaughten
- 6187 Barberry Hollow
- 622 Brice Rd
- 544 Waring Way
- 6033 McNaughten Grove Ln
- 6483 Borr Ave
- 5909 Whitman Rd
- 1128 Alexandria Rd
- 458 Brice Rd
- 893 Hunt Valley Dr
- 6571 Schenk Ave
- 445 Hawthorne Place
- 6560 Schenk Ave
- 6737 Rocky Den Rd
- 0 Manor Dr Unit 226002263
- 5825 Bastille Place Unit 69
- 6128 Olde Orchard Dr
- 734 Olde Orchard Ct
- 6094 Olde Orchard Dr
- 6146 Olde Orchard Dr
- 737 Olde Orchard Ct
- 722 Olde Orchard Ct
- 668 Olde Orchard Ct
- 6080 Olde Orchard Dr
- 790 Harvest Lane Ct
- 662 Olde Orchard Ct
- 725 Olde Orchard Ct
- 656 Olde Orchard Ct
- 650 Olde Orchard Ct
- 803 Harvest Lane Ct
- 644 Olde Orchard Ct
- 638 Olde Orchard Ct
- 632 Olde Orchard Ct
- 710 Olde Orchard Ct
- 6066 Olde Orchard Dr
- 626 Olde Orchard Ct
Your Personal Tour Guide
Ask me questions while you tour the home.