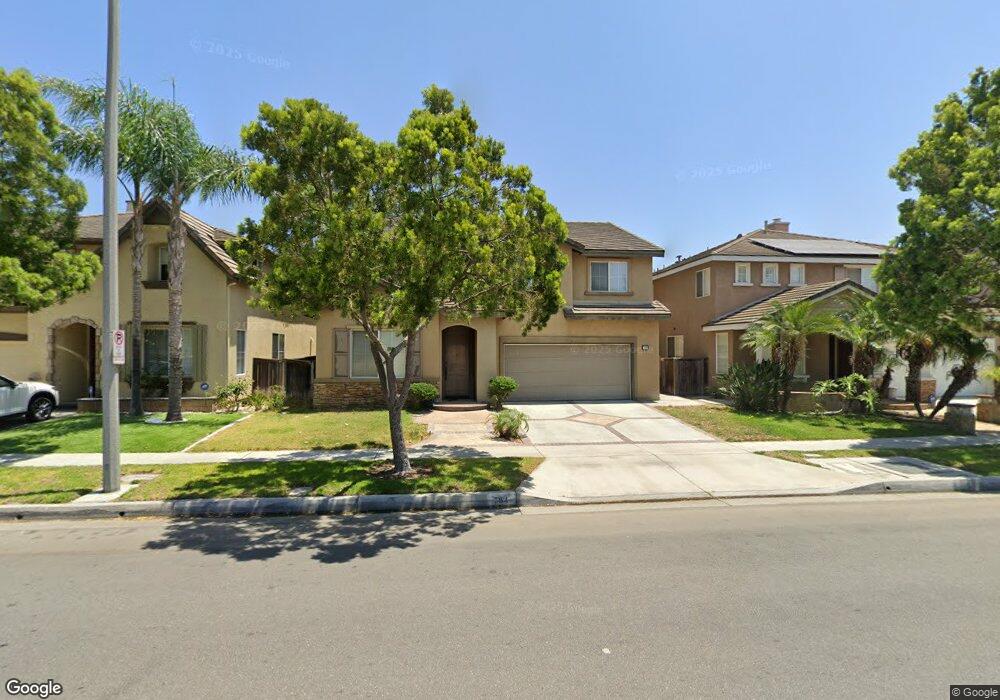
754 S Halliday St Anaheim, CA 92804
West Anaheim NeighborhoodEstimated Value: $1,182,000 - $1,267,000
4
Beds
3
Baths
2,600
Sq Ft
$466/Sq Ft
Est. Value
About This Home
This home is located at 754 S Halliday St, Anaheim, CA 92804 and is currently estimated at $1,211,413, approximately $465 per square foot. 754 S Halliday St is a home located in Orange County with nearby schools including Twila Reid Elementary, Orangeview Junior High, and Western High School.
Ownership History
Date
Name
Owned For
Owner Type
Purchase Details
Closed on
Jan 21, 2000
Sold by
Greystone Homes Inc
Bought by
Chang Il Shin and Chang Mi Ja
Current Estimated Value
Home Financials for this Owner
Home Financials are based on the most recent Mortgage that was taken out on this home.
Original Mortgage
$227,990
Outstanding Balance
$73,092
Interest Rate
7.96%
Mortgage Type
Stand Alone First
Estimated Equity
$1,138,321
Create a Home Valuation Report for This Property
The Home Valuation Report is an in-depth analysis detailing your home's value as well as a comparison with similar homes in the area
Home Values in the Area
Average Home Value in this Area
Purchase History
| Date | Buyer | Sale Price | Title Company |
|---|---|---|---|
| Chang Il Shin | $328,000 | North American Title Co |
Source: Public Records
Mortgage History
| Date | Status | Borrower | Loan Amount |
|---|---|---|---|
| Open | Chang Il Shin | $227,990 |
Source: Public Records
Tax History Compared to Growth
Tax History
| Year | Tax Paid | Tax Assessment Tax Assessment Total Assessment is a certain percentage of the fair market value that is determined by local assessors to be the total taxable value of land and additions on the property. | Land | Improvement |
|---|---|---|---|---|
| 2025 | $6,012 | $514,746 | $171,132 | $343,614 |
| 2024 | $6,012 | $504,653 | $167,776 | $336,877 |
| 2023 | $5,859 | $494,758 | $164,486 | $330,272 |
| 2022 | $5,744 | $485,057 | $161,260 | $323,797 |
| 2021 | $5,801 | $475,547 | $158,098 | $317,449 |
| 2020 | $5,723 | $470,671 | $156,477 | $314,194 |
| 2019 | $5,565 | $461,443 | $153,409 | $308,034 |
| 2018 | $5,488 | $452,396 | $150,401 | $301,995 |
| 2017 | $5,298 | $443,526 | $147,452 | $296,074 |
| 2016 | $5,277 | $434,830 | $144,561 | $290,269 |
| 2015 | $5,222 | $428,299 | $142,390 | $285,909 |
| 2014 | $4,955 | $419,910 | $139,601 | $280,309 |
Source: Public Records
Map
Nearby Homes
- 716 S Hayward St Unit 2
- 612 S Halliday St
- 3115 W Teranimar Dr
- 900 S Hayward St
- 235 S Beach Blvd Unit 132
- 1203 S Courtright St
- 2945 W Bridgeport Ave
- 3050 W Ball Rd Unit 88
- 3050 W Ball Rd Unit 127
- 3050 W Ball Rd Unit 132
- 3050 W Ball Rd Unit 82
- 3050 W Ball Rd Unit 171
- 3050 W Ball Rd Unit 200
- 2942 W Floyd Ave
- 211 S Beach Blvd Unit 92
- 3300 W Orange Ave
- 3218 W Ravenswood Dr
- 3333 W Keys Ln
- 7850 2nd St
- 10291 Wyatt Rd
- 746 S Halliday St
- 762 S Halliday St
- 763 S Lassen Ct
- 755 S Lassen Ct
- 771 S Lassen Ct
- 738 S Halliday St
- 770 S Halliday St
- 779 S Lassen Ct
- 747 S Lassen Ct
- 730 S Halliday St
- 778 S Halliday St
- 739 S Lassen Ct
- 789 S Lassen Ct
- 722 S Halliday St
- 786 S Halliday St
- 760 S Lassen Ct
- 731 S Lassen Ct
- 768 S Lassen Ct
- 752 S Lassen Ct
- 744 S Lassen Ct