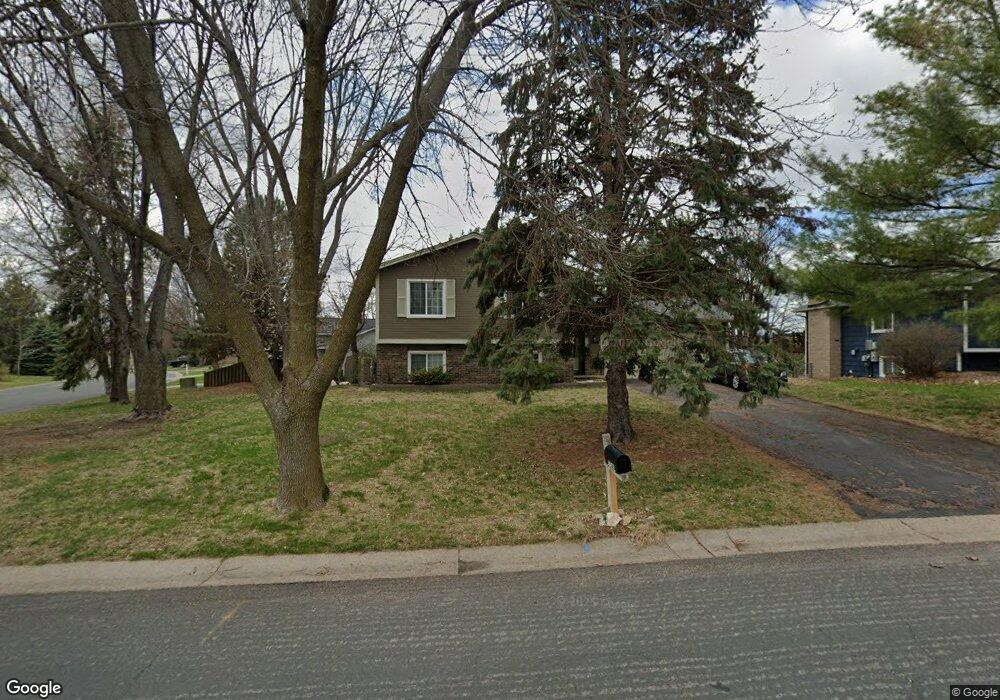
7540 Chippewa Trail Chanhassen, MN 55317
Estimated Value: $390,000 - $445,000
4
Beds
2
Baths
952
Sq Ft
$445/Sq Ft
Est. Value
About This Home
This home is located at 7540 Chippewa Trail, Chanhassen, MN 55317 and is currently estimated at $423,177, approximately $444 per square foot. 7540 Chippewa Trail is a home located in Carver County with nearby schools including Chanhassen Elementary School, Pioneer Ridge Middle School, and Chanhassen High School.
Ownership History
Date
Name
Owned For
Owner Type
Purchase Details
Closed on
Dec 22, 2021
Sold by
Hpa Us1 Llc
Bought by
Sfr Ii Borrower 2021-3 Llc
Current Estimated Value
Purchase Details
Closed on
Jun 30, 2021
Sold by
Lang Troy and Lang Alison
Bought by
Hpa Us1 Llc
Purchase Details
Closed on
Nov 28, 2005
Sold by
Buscemi Joseph D and Buscemi Christine A
Bought by
Hanno Alison K
Home Financials for this Owner
Home Financials are based on the most recent Mortgage that was taken out on this home.
Original Mortgage
$200,000
Interest Rate
6.2%
Mortgage Type
Purchase Money Mortgage
Purchase Details
Closed on
Aug 27, 1997
Sold by
Jones John P and Jones Kimberly B
Bought by
Buscemi Joseph D and Buscemi Christine A
Purchase Details
Closed on
May 13, 1996
Sold by
Bollog Timothy and Bollog Dana
Bought by
Jones John P and Jones Kimberly B
Create a Home Valuation Report for This Property
The Home Valuation Report is an in-depth analysis detailing your home's value as well as a comparison with similar homes in the area
Home Values in the Area
Average Home Value in this Area
Purchase History
| Date | Buyer | Sale Price | Title Company |
|---|---|---|---|
| Sfr Ii Borrower 2021-3 Llc | $500 | Stewart Title | |
| Hpa Us1 Llc | $395,000 | Realtch Title Llc | |
| Hanno Alison K | $257,000 | -- | |
| Buscemi Joseph D | $133,000 | -- | |
| Jones John P | $129,500 | -- | |
| -- | $395,000 | -- |
Source: Public Records
Mortgage History
| Date | Status | Borrower | Loan Amount |
|---|---|---|---|
| Previous Owner | Hanno Alison K | $200,000 |
Source: Public Records
Tax History Compared to Growth
Tax History
| Year | Tax Paid | Tax Assessment Tax Assessment Total Assessment is a certain percentage of the fair market value that is determined by local assessors to be the total taxable value of land and additions on the property. | Land | Improvement |
|---|---|---|---|---|
| 2025 | $3,606 | $367,300 | $142,500 | $224,800 |
| 2024 | $3,578 | $346,700 | $128,300 | $218,400 |
| 2023 | $3,544 | $346,700 | $128,300 | $218,400 |
| 2022 | $3,252 | $346,500 | $128,300 | $218,200 |
| 2021 | $3,078 | $279,600 | $107,700 | $171,900 |
| 2020 | $3,094 | $274,500 | $107,700 | $166,800 |
| 2019 | $3,428 | $256,600 | $102,600 | $154,000 |
| 2018 | $3,444 | $256,600 | $102,600 | $154,000 |
| 2017 | $3,096 | $244,200 | $95,000 | $149,200 |
| 2016 | $3,132 | $210,700 | $0 | $0 |
| 2015 | $3,110 | $224,100 | $0 | $0 |
| 2014 | $3,110 | $193,800 | $0 | $0 |
Source: Public Records
Map
Nearby Homes
- 710 W Village Rd Unit 105
- 7639 Nicholas Way
- 5523 Game Farm Lookout
- 760 Bighorn Dr
- 1003 Pontiac Ln
- 601 Fox Hill Dr
- 7490 Chanhassen Rd
- 834 Cree Dr
- 1000 Carver Beach Rd
- 6690 Nez Perce Dr
- 1321 Lake Dr W Unit 216
- 1321 Lake Dr W Unit 109
- 6620 Horseshoe Curve
- 1250 Lake Susan Hills Dr
- 8410 Burlwood Dr
- 1350 Heather Ct
- 7080 Quail Cir
- 970 Pleasantview Rd
- 460 Indian Hill Rd
- 450 Indian Hill Rd
- 7520 Chippewa Trail
- 740 Santa Vera Dr
- 7541 Chippewa Trail
- 7500 Chippewa Trail
- 7521 Chippewa Trail
- 760 Santa Vera Dr
- 7550 Chippewa Trail
- 725 Santa Vera Dr
- 7490 Chippewa Trail
- 7501 Chippewa Trail
- 7560 Chippewa Trail
- 705 Santa Vera Dr
- 780 Santa Vera Dr
- 785 Santa Vera Dr
- 7495 Chippewa Trail
- 7480 Chippewa Trail
- 751 Chippewa Cir
- 7571 Chippewa Trail
- 642 Santa Vera Dr
- 790 Santa Vera Dr