Estimated Value: $109,000 - $117,000
1
Bed
1
Bath
700
Sq Ft
$161/Sq Ft
Est. Value
About This Home
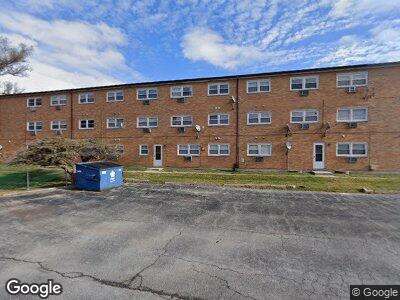
This home is located at 7540 W 111th St Unit 1, Worth, IL 60482 and is currently estimated at $112,637, approximately $160 per square foot. 7540 W 111th St Unit 1 is a home located in Cook County with nearby schools including Worthwoods Elementary School, Worth Jr High School, and Amos Alonzo Stagg High School.
Ownership History
Date
Name
Owned For
Owner Type
Purchase Details
Closed on
Mar 19, 2021
Sold by
Mbh Properties Inc
Bought by
Mauriello Angela
Current Estimated Value
Purchase Details
Closed on
Apr 12, 2006
Sold by
Hopp Mark H and Hopp Barbara A
Bought by
Mbh Properties Inc
Purchase Details
Closed on
Dec 21, 2001
Sold by
First Midwest Bank
Bought by
Hopp Mark H and Hopp Barbara A
Home Financials for this Owner
Home Financials are based on the most recent Mortgage that was taken out on this home.
Original Mortgage
$54,000
Interest Rate
7.07%
Purchase Details
Closed on
May 30, 2001
Sold by
Meyer
Bought by
First Midwest Trust Company and Trust #5711
Purchase Details
Closed on
Sep 19, 1994
Sold by
Cantwell Thomas P
Bought by
Meyer Mark D
Home Financials for this Owner
Home Financials are based on the most recent Mortgage that was taken out on this home.
Original Mortgage
$48,000
Interest Rate
6.5%
Create a Home Valuation Report for This Property
The Home Valuation Report is an in-depth analysis detailing your home's value as well as a comparison with similar homes in the area
Home Values in the Area
Average Home Value in this Area
Purchase History
| Date | Buyer | Sale Price | Title Company |
|---|---|---|---|
| Mauriello Angela | $77,000 | Chicago Title Insurance Co | |
| Mbh Properties Inc | -- | None Available | |
| Hopp Mark H | $60,000 | -- | |
| First Midwest Trust Company | -- | -- | |
| Meyer Mark D | $61,000 | -- |
Source: Public Records
Mortgage History
| Date | Status | Borrower | Loan Amount |
|---|---|---|---|
| Previous Owner | Hopp Mark H | $55,000 | |
| Previous Owner | Hopp Mark H | $54,000 | |
| Previous Owner | Meyer Mark D | $16,075 | |
| Previous Owner | Meyer Mark D | $48,000 |
Source: Public Records
Tax History Compared to Growth
Tax History
| Year | Tax Paid | Tax Assessment Tax Assessment Total Assessment is a certain percentage of the fair market value that is determined by local assessors to be the total taxable value of land and additions on the property. | Land | Improvement |
|---|---|---|---|---|
| 2024 | $1,197 | $8,612 | $1,154 | $7,458 |
| 2023 | $1,197 | $8,612 | $1,154 | $7,458 |
| 2022 | $1,197 | $6,517 | $2,092 | $4,425 |
| 2021 | $2,443 | $6,515 | $2,091 | $4,424 |
| 2020 | $2,355 | $6,515 | $2,091 | $4,424 |
| 2019 | $1,880 | $4,932 | $1,911 | $3,021 |
| 2018 | $1,914 | $4,932 | $1,911 | $3,021 |
| 2017 | $1,851 | $4,932 | $1,911 | $3,021 |
| 2016 | $2,220 | $5,434 | $1,658 | $3,776 |
| 2015 | $2,188 | $5,434 | $1,658 | $3,776 |
| 2014 | $2,209 | $5,585 | $1,658 | $3,927 |
| 2013 | $3,114 | $8,709 | $1,658 | $7,051 |
Source: Public Records
Map
Nearby Homes
- 11001 S 76th Ave
- 7239 W 110th St
- 7400 W 113th Place
- 7319 W 113th St
- 7236 W 114th St
- 11307 Moraine Dr Unit E
- 11277 S Roberts Rd Unit G
- 10751 S Harlem Ave Unit 1E
- 11050 S Roberts Rd
- 7125 W 113th St
- 7108 W 108th St Unit 102
- 7007 W 110th St
- 10640 S Brooklodge Ln Unit 1B
- 11020 Eagle Dr Unit B
- 11026 S Worth Ave
- 10816 S Nordica Ave
- 10940 S Worth Ave Unit 9
- 10940 S Worth Ave Unit 1094011
- 10539 S Vicky Ln
- 11036 S Worth Ave
- 7540 W 111th St Unit 1F
- 7540 W 111th St Unit 2
- 7540 W 111th St Unit 3
- 7540 W 111th St Unit 3
- 7540 W 111th St Unit 3
- 7540 W 111th St Unit 3
- 7540 W 111th St Unit 2
- 7540 W 111th St Unit 2
- 7540 W 111th St Unit 1
- 7540 W 111th St Unit 1
- 7540 W 111th St Unit 1
- 7540 W 111th St Unit 3
- 7540 W 111th St Unit 2
- 7540 W 111th St Unit 1
- 7540 W 111th St Unit 3
- 7540 W 111th St Unit 1
- 7540 W 111th St Unit 2
- 7540 W 111th St Unit 2
- 7540 W 111th St Unit 1
- 7540 W 111th St Unit 2F