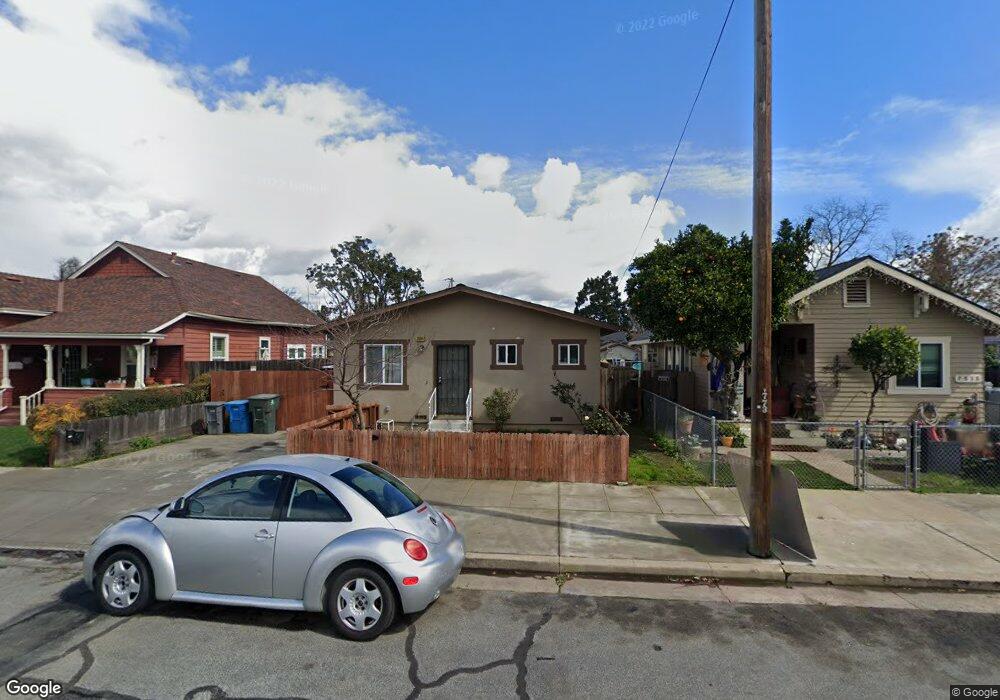
7544 Alexander St Gilroy, CA 95020
Estimated Value: $742,000 - $858,000
3
Beds
2
Baths
1,100
Sq Ft
$730/Sq Ft
Est. Value
About This Home
This home is located at 7544 Alexander St, Gilroy, CA 95020 and is currently estimated at $803,171, approximately $730 per square foot. 7544 Alexander St is a home located in Santa Clara County with nearby schools including Eliot Elementary School, Brownell Middle School, and Solorsano Middle School.
Ownership History
Date
Name
Owned For
Owner Type
Purchase Details
Closed on
Nov 21, 2024
Sold by
Liv Albert M and Liv Maria
Bought by
Rocha Albert M and Rocha Maria G
Current Estimated Value
Purchase Details
Closed on
May 2, 2006
Sold by
Rocha Albert M and Rocha Maria G
Bought by
Rocha Albert M and Rocha Maria G
Purchase Details
Closed on
Apr 21, 1999
Sold by
Kretz Rozene L and Salustro Terry A
Bought by
Rocha Albert M and Rocha Maria G
Home Financials for this Owner
Home Financials are based on the most recent Mortgage that was taken out on this home.
Original Mortgage
$143,600
Interest Rate
6.98%
Mortgage Type
Stand Alone First
Purchase Details
Closed on
Nov 4, 1998
Sold by
Salustro Louise M Living Trust and Rozene L
Bought by
Kretz Rozene L and Salustro Terry A
Create a Home Valuation Report for This Property
The Home Valuation Report is an in-depth analysis detailing your home's value as well as a comparison with similar homes in the area
Home Values in the Area
Average Home Value in this Area
Purchase History
| Date | Buyer | Sale Price | Title Company |
|---|---|---|---|
| Rocha Albert M | -- | None Listed On Document | |
| Albert M And Maria G Rocha Revocable Living T | -- | None Listed On Document | |
| Rocha Albert M | -- | None Listed On Document | |
| Rocha Albert M | -- | None Available | |
| Rocha Albert M | $179,500 | Commonwealth Land Title Co | |
| Kretz Rozene L | -- | -- |
Source: Public Records
Mortgage History
| Date | Status | Borrower | Loan Amount |
|---|---|---|---|
| Previous Owner | Rocha Albert M | $143,600 |
Source: Public Records
Tax History
| Year | Tax Paid | Tax Assessment Tax Assessment Total Assessment is a certain percentage of the fair market value that is determined by local assessors to be the total taxable value of land and additions on the property. | Land | Improvement |
|---|---|---|---|---|
| 2025 | $5,611 | $456,246 | $156,761 | $299,485 |
| 2024 | $5,611 | $447,301 | $153,688 | $293,613 |
| 2023 | $5,578 | $438,531 | $150,675 | $287,856 |
| 2022 | $5,486 | $429,933 | $147,721 | $282,212 |
| 2021 | $5,461 | $421,504 | $144,825 | $276,679 |
| 2020 | $5,401 | $417,182 | $143,340 | $273,842 |
| 2019 | $5,352 | $409,003 | $140,530 | $268,473 |
| 2018 | $4,999 | $400,984 | $137,775 | $263,209 |
| 2017 | $5,103 | $393,123 | $135,074 | $258,049 |
| 2016 | $4,998 | $385,416 | $132,426 | $252,990 |
| 2015 | $4,717 | $379,627 | $130,437 | $249,190 |
| 2014 | -- | $372,191 | $127,882 | $244,309 |
Source: Public Records
Map
Nearby Homes
- 7621 Forest St
- 332 Lewis St Unit 1/2
- 332 Lewis St
- 7429 Alexander St
- 160 Sarafina Way
- 0 Monterey Rd
- 111 5th St
- 7711 Monterey St
- 194 4th St
- 7691 Church St Unit B
- 7601 Rosanna St
- 7681 Hanna St
- 8282 Murray Ave Unit 99
- 440 W 7th St
- 7051 Eigleberry St
- 700 Eschenburg Dr
- 7351 Princevalle St Unit Homesite 18
- 7392 Ailes Ct
- 7384 Ailes Ct
- 7376 Ailes Ct
- 7540 Alexander St
- 7554 Alexander St
- 7530 Alexander St
- 7566 Alexander St
- 7520 Alexander St
- 7518 Alexander St
- 7549 Forest St
- 7578 Alexander St
- 7541 Forest St
- 7531 Forest St
- 7557 Forest St
- 229 Martin St
- 209 Martin St
- 7541 Alexander St
- 7567 Forest St
- 7584 Alexander St
- 7531 Alexander St
- 7551 Alexander St
- 267 Martin St
- 7521 Alexander St
Your Personal Tour Guide
Ask me questions while you tour the home.