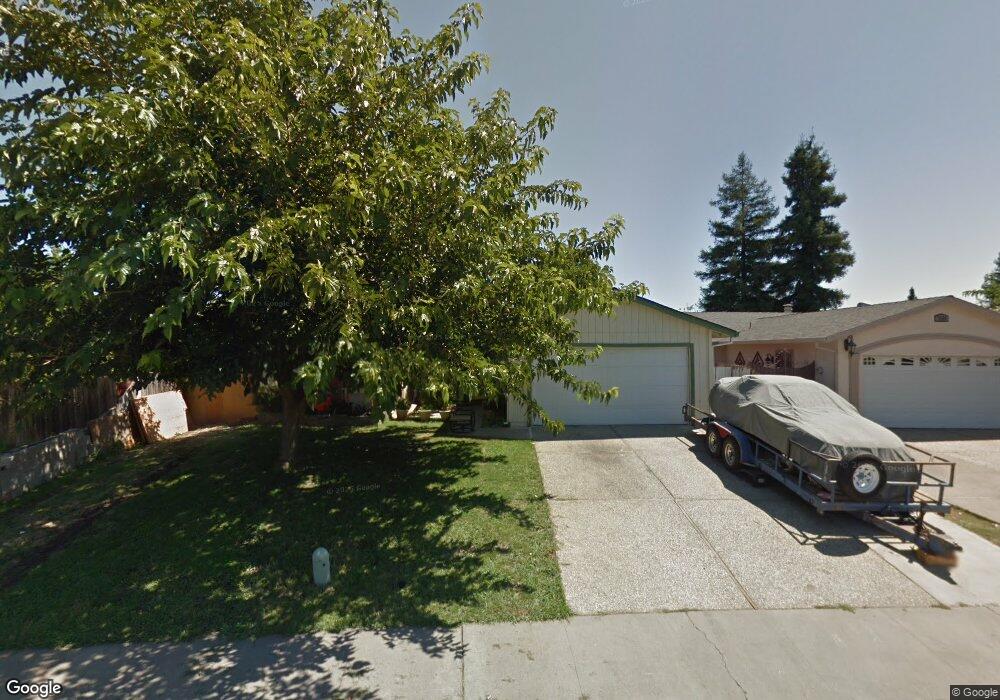
7547 Pinon Way Sacramento, CA 95823
Estimated Value: $246,000 - $432,293
3
Beds
2
Baths
1,332
Sq Ft
$288/Sq Ft
Est. Value
About This Home
This home is located at 7547 Pinon Way, Sacramento, CA 95823 and is currently estimated at $383,823, approximately $288 per square foot. 7547 Pinon Way is a home located in Sacramento County with nearby schools including Edward Kemble Elementary School, Cesar Chavez Intermediate School, and Fern Bacon Middle School.
Ownership History
Date
Name
Owned For
Owner Type
Purchase Details
Closed on
Jul 18, 2017
Sold by
Leon Jose and Leon Lydia
Bought by
Vazquez Alfredo Villanueva and Villasenor Juana Alejandra Pulido
Current Estimated Value
Home Financials for this Owner
Home Financials are based on the most recent Mortgage that was taken out on this home.
Original Mortgage
$233,689
Outstanding Balance
$192,038
Interest Rate
3.5%
Mortgage Type
FHA
Estimated Equity
$191,785
Purchase Details
Closed on
Jun 27, 2001
Sold by
Va
Bought by
Leon Jose and Leon Lydia
Home Financials for this Owner
Home Financials are based on the most recent Mortgage that was taken out on this home.
Original Mortgage
$108,337
Interest Rate
7.14%
Mortgage Type
Seller Take Back
Purchase Details
Closed on
Jul 5, 1999
Sold by
Villia Smith Charles Bryant and Villia Katy
Bought by
Va and Administrator Of Va
Create a Home Valuation Report for This Property
The Home Valuation Report is an in-depth analysis detailing your home's value as well as a comparison with similar homes in the area
Home Values in the Area
Average Home Value in this Area
Purchase History
| Date | Buyer | Sale Price | Title Company |
|---|---|---|---|
| Vazquez Alfredo Villanueva | $238,000 | Placer Title Company | |
| Leon Jose | $120,500 | -- | |
| Va | $69,344 | -- |
Source: Public Records
Mortgage History
| Date | Status | Borrower | Loan Amount |
|---|---|---|---|
| Open | Vazquez Alfredo Villanueva | $233,689 | |
| Previous Owner | Leon Jose | $108,337 |
Source: Public Records
Tax History Compared to Growth
Tax History
| Year | Tax Paid | Tax Assessment Tax Assessment Total Assessment is a certain percentage of the fair market value that is determined by local assessors to be the total taxable value of land and additions on the property. | Land | Improvement |
|---|---|---|---|---|
| 2025 | $3,399 | $270,799 | $65,708 | $205,091 |
| 2024 | $3,399 | $265,490 | $64,420 | $201,070 |
| 2023 | $3,312 | $260,285 | $63,157 | $197,128 |
| 2022 | $3,271 | $255,182 | $61,919 | $193,263 |
| 2021 | $3,114 | $250,179 | $60,705 | $189,474 |
| 2020 | $3,132 | $247,615 | $60,083 | $187,532 |
| 2019 | $3,067 | $242,760 | $58,905 | $183,855 |
| 2018 | $2,988 | $238,000 | $57,750 | $180,250 |
| 2017 | $2,069 | $156,438 | $25,960 | $130,478 |
| 2016 | $1,956 | $153,371 | $25,451 | $127,920 |
| 2015 | $1,922 | $151,068 | $25,069 | $125,999 |
| 2014 | $1,880 | $148,109 | $24,578 | $123,531 |
Source: Public Records
Map
Nearby Homes
- 4102 Weymouth Ln
- 4095 Weymouth Ln
- 7570 Burgoyne Ln
- 7507 Mandy Dr
- 3985 Limestone Way
- 197 Creekside Cir
- 192 Creekside Cir
- 4359 Shining Star Dr Unit 4
- 3765 Samos Way
- 7521 Sun Willow Ln
- 3361 Jola Cir
- 410 Sun Shower Cir
- 7416 Franklin Blvd Unit 4
- 65 La Fresa Ct Unit 2
- 4537 Goya Pkwy
- 4400 C Pkwy
- 3950 Mack Rd Unit 66
- 3950 Mack Rd Unit 182
- 3950 Mack Rd Unit 129
- 3950 Mack Rd Unit 169