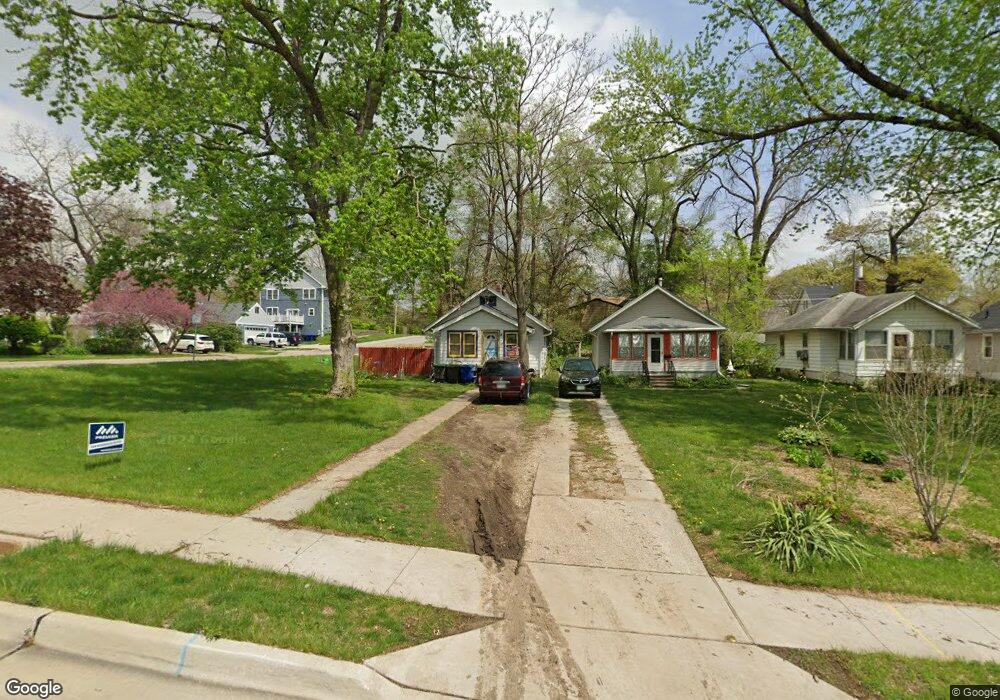
755 25th St Des Moines, IA 50312
Woodland Heights NeighborhoodEstimated Value: $100,561 - $146,000
1
Bed
1
Bath
572
Sq Ft
$207/Sq Ft
Est. Value
About This Home
This home is located at 755 25th St, Des Moines, IA 50312 and is currently estimated at $118,140, approximately $206 per square foot. 755 25th St is a home located in Polk County with nearby schools including Greenwood Elementary School and Roosevelt High School.
Ownership History
Date
Name
Owned For
Owner Type
Purchase Details
Closed on
Oct 2, 2002
Sold by
Howe Dan L and Howe Robbie L
Bought by
Hall Len
Current Estimated Value
Home Financials for this Owner
Home Financials are based on the most recent Mortgage that was taken out on this home.
Original Mortgage
$52,000
Interest Rate
6.3%
Purchase Details
Closed on
Jun 30, 2000
Sold by
Howe Dan L and Howe Robbie L
Bought by
Hall Len
Home Financials for this Owner
Home Financials are based on the most recent Mortgage that was taken out on this home.
Original Mortgage
$38,070
Interest Rate
13.55%
Mortgage Type
Seller Take Back
Purchase Details
Closed on
Jan 23, 1999
Sold by
Stockley Betty
Bought by
Howe Dan L
Create a Home Valuation Report for This Property
The Home Valuation Report is an in-depth analysis detailing your home's value as well as a comparison with similar homes in the area
Home Values in the Area
Average Home Value in this Area
Purchase History
| Date | Buyer | Sale Price | Title Company |
|---|---|---|---|
| Hall Len | $42,500 | -- | |
| Hall Len | $42,900 | -- | |
| Howe Dan L | $28,000 | -- |
Source: Public Records
Mortgage History
| Date | Status | Borrower | Loan Amount |
|---|---|---|---|
| Previous Owner | Hall Len | $52,000 | |
| Previous Owner | Hall Len | $38,070 |
Source: Public Records
Tax History Compared to Growth
Tax History
| Year | Tax Paid | Tax Assessment Tax Assessment Total Assessment is a certain percentage of the fair market value that is determined by local assessors to be the total taxable value of land and additions on the property. | Land | Improvement |
|---|---|---|---|---|
| 2025 | $1,234 | $90,600 | $29,700 | $60,900 |
| 2024 | $1,234 | $80,200 | $26,100 | $54,100 |
| 2023 | $1,306 | $80,200 | $26,100 | $54,100 |
| 2022 | $1,294 | $64,300 | $21,300 | $43,000 |
| 2021 | $1,206 | $64,300 | $21,300 | $43,000 |
| 2020 | $1,246 | $56,900 | $19,000 | $37,900 |
| 2019 | $1,114 | $56,900 | $19,000 | $37,900 |
| 2018 | $1,098 | $50,000 | $16,600 | $33,400 |
| 2017 | $1,058 | $50,000 | $16,600 | $33,400 |
| 2016 | $1,024 | $47,600 | $15,700 | $31,900 |
| 2015 | $1,024 | $47,600 | $15,700 | $31,900 |
| 2014 | $876 | $43,100 | $14,200 | $28,900 |
Source: Public Records
Map
Nearby Homes