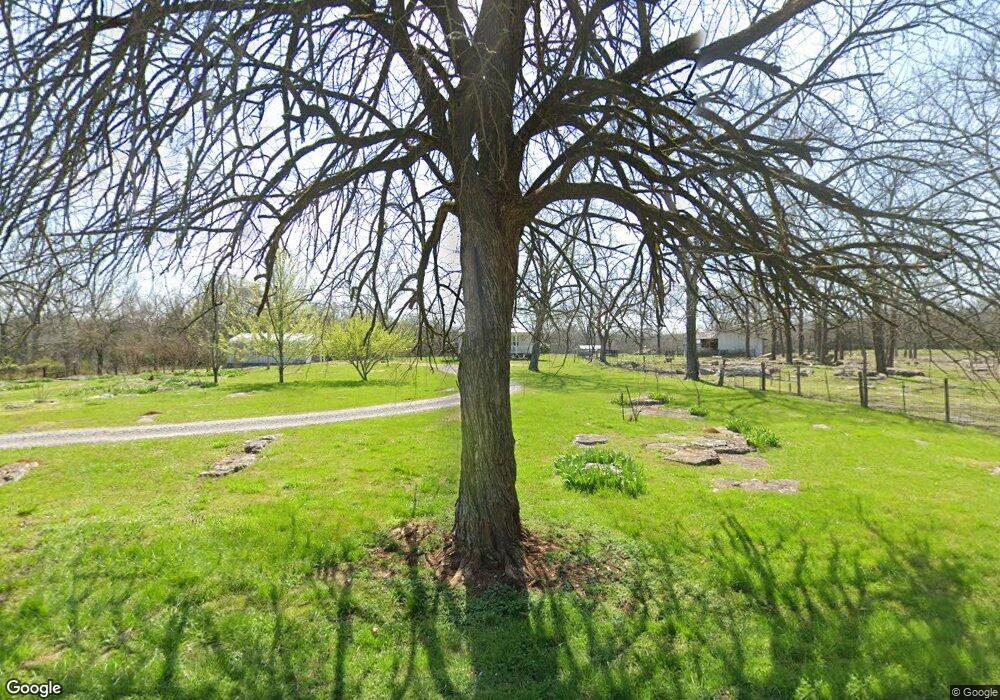
755 Double Bridge Rd Lewisburg, TN 37091
Estimated Value: $339,000 - $465,000
--
Bed
1
Bath
1,590
Sq Ft
$258/Sq Ft
Est. Value
About This Home
This home is located at 755 Double Bridge Rd, Lewisburg, TN 37091 and is currently estimated at $409,585, approximately $257 per square foot. 755 Double Bridge Rd is a home located in Marshall County with nearby schools including Oak Grove Elementary School, Marshall Elementary School, and Westhills Elementary School.
Ownership History
Date
Name
Owned For
Owner Type
Purchase Details
Closed on
Jun 3, 2010
Sold by
Fay Milton
Bought by
Cox James H
Current Estimated Value
Create a Home Valuation Report for This Property
The Home Valuation Report is an in-depth analysis detailing your home's value as well as a comparison with similar homes in the area
Home Values in the Area
Average Home Value in this Area
Purchase History
| Date | Buyer | Sale Price | Title Company |
|---|---|---|---|
| Cox James H | $36,000 | -- |
Source: Public Records
Tax History Compared to Growth
Tax History
| Year | Tax Paid | Tax Assessment Tax Assessment Total Assessment is a certain percentage of the fair market value that is determined by local assessors to be the total taxable value of land and additions on the property. | Land | Improvement |
|---|---|---|---|---|
| 2024 | $1,612 | $88,650 | $27,475 | $61,175 |
| 2023 | $1,561 | $88,650 | $27,475 | $61,175 |
| 2022 | $1,561 | $85,825 | $27,475 | $58,350 |
| 2021 | $1,351 | $48,050 | $11,650 | $36,400 |
| 2020 | $1,351 | $48,050 | $11,650 | $36,400 |
| 2019 | $1,351 | $48,050 | $11,650 | $36,400 |
| 2018 | $1,290 | $46,700 | $11,650 | $35,050 |
| 2017 | $1,290 | $46,700 | $11,650 | $35,050 |
| 2016 | $1,228 | $38,125 | $9,200 | $28,925 |
| 2015 | $1,228 | $38,125 | $9,200 | $28,925 |
| 2014 | $1,228 | $38,125 | $9,200 | $28,925 |
Source: Public Records
Map
Nearby Homes
- 2159 Verona Caney Rd
- 1800 Mcbride Rd
- 0 Wallace Thompson Rd
- 1830 Bethbirei Rd
- 1755 Mcbride Rd
- 1180 Snell Rd
- 1510 Wade Brown Rd
- 2421 Anes Station Rd
- 2512 Verona Caney Rd
- 1717 Savannah Pass
- 1714 Savannah Pass
- 1727 Savannah Pass
- 1713 Savannah Pass
- 1715 Savannah Pass
- 1716 Savannah Pass
- 1712 Savannah Pass
- 1344 Grassy Plains Pass
- 1816 Wade Brown Rd
- 1401 Hobby Ln
- 1719 Savannah Pass
- 727 Double Bridge Rd
- 716 Double Bridge Rd
- 1980 Verona Caney Rd
- 1986 Verona Caney Rd
- 2050 Verona Caney Rd
- 2025 Verona Caney Rd
- 2019 Verona Caney Rd
- 2011 Verona Caney Rd
- 1970 Verona Caney Rd
- 1965 Verona Caney Rd
- 750 Snell Rd
- 845 Double Bridge Rd
- 800 Snell Rd
- 2097 Verona Caney Rd
- 320 Old Thomas Bridge Rd
- 1926 Verona Caney Rd
- 2117 Verona Caney Rd
- 2140 Verona Caney Rd
- 2077 Verona Caney Rd
- 894 Double Bridge Rd Unit BRIDGES