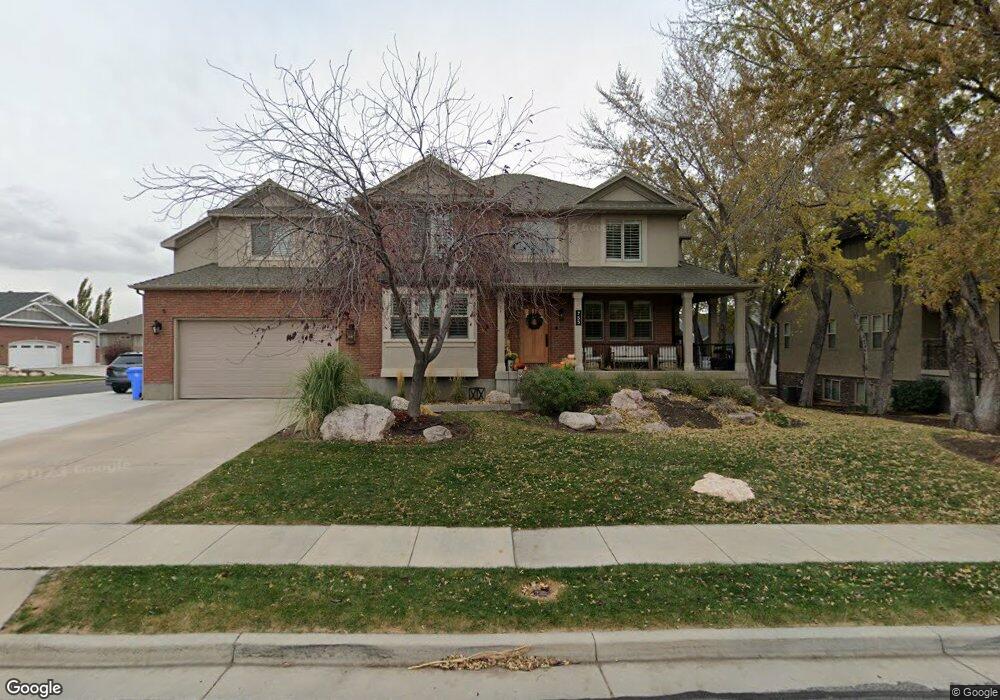
755 N 700 W West Bountiful, UT 84087
Estimated Value: $892,000 - $1,164,000
4
Beds
3
Baths
4,494
Sq Ft
$225/Sq Ft
Est. Value
About This Home
This home is located at 755 N 700 W, West Bountiful, UT 84087 and is currently estimated at $1,011,015, approximately $224 per square foot. 755 N 700 W is a home located in Davis County with nearby schools including West Bountiful Elementary School, Bountiful Junior High School, and Viewmont High School.
Ownership History
Date
Name
Owned For
Owner Type
Purchase Details
Closed on
Nov 1, 2012
Sold by
Federal National Mortgage Association
Bought by
Kol Jason
Current Estimated Value
Home Financials for this Owner
Home Financials are based on the most recent Mortgage that was taken out on this home.
Original Mortgage
$323,618
Outstanding Balance
$223,249
Interest Rate
3.43%
Mortgage Type
New Conventional
Estimated Equity
$787,766
Purchase Details
Closed on
Apr 16, 2012
Sold by
Jordan Jon E and Jordan Michelle K
Bought by
Federal National Mortgage Association
Purchase Details
Closed on
Jul 18, 2005
Sold by
Triple S Development Inc
Bought by
Jordan Jon E and Jordan Michelle K
Home Financials for this Owner
Home Financials are based on the most recent Mortgage that was taken out on this home.
Original Mortgage
$324,700
Interest Rate
5.55%
Mortgage Type
Construction
Create a Home Valuation Report for This Property
The Home Valuation Report is an in-depth analysis detailing your home's value as well as a comparison with similar homes in the area
Home Values in the Area
Average Home Value in this Area
Purchase History
| Date | Buyer | Sale Price | Title Company |
|---|---|---|---|
| Kol Jason | -- | Backman Title Service | |
| Federal National Mortgage Association | $399,648 | Etitle Insurance Age | |
| Jordan Jon E | -- | Aspen Title Insurance Agency |
Source: Public Records
Mortgage History
| Date | Status | Borrower | Loan Amount |
|---|---|---|---|
| Open | Kol Jason | $323,618 | |
| Previous Owner | Jordan Jon E | $324,700 |
Source: Public Records
Tax History Compared to Growth
Tax History
| Year | Tax Paid | Tax Assessment Tax Assessment Total Assessment is a certain percentage of the fair market value that is determined by local assessors to be the total taxable value of land and additions on the property. | Land | Improvement |
|---|---|---|---|---|
| 2025 | $5,725 | $515,350 | $132,670 | $382,680 |
| 2024 | $5,369 | $493,900 | $109,089 | $384,811 |
| 2023 | $5,100 | $858,000 | $206,433 | $651,567 |
| 2022 | $5,039 | $473,000 | $98,966 | $374,034 |
| 2021 | $4,674 | $674,000 | $133,412 | $540,588 |
| 2020 | $4,076 | $581,000 | $123,861 | $457,139 |
| 2019 | $4,069 | $573,000 | $125,032 | $447,968 |
| 2018 | $3,829 | $531,000 | $125,302 | $405,698 |
| 2016 | $3,128 | $233,365 | $56,835 | $176,530 |
| 2015 | $3,322 | $235,565 | $56,835 | $178,730 |
| 2014 | $2,828 | $205,253 | $56,835 | $148,418 |
| 2013 | -- | $191,950 | $47,359 | $144,591 |
Source: Public Records
Map
Nearby Homes
- 825 W 1320 N
- 790 N 500 W
- 366 W 1000 N
- 767 W 220 N
- 340 N 500 W Unit 204
- 399 W 400 N Unit 47
- 637 W 1600 N
- Lincoln Farmhouse Plan at Belmont Farms
- Belmont Traditional Plan at Belmont Farms
- Hampton Traditional Plan at Belmont Farms
- 553 N 200 W
- 499 N 200 W Unit 30
- 499 N 200 W Unit 19
- 184 Park Shadows Cir
- 1503 N 300 W
- 235 W 1400 N
- 1194 N 200 W
- 810 Park Shadows Cir
- 280 N 1100 W
- 1260 N 200 W