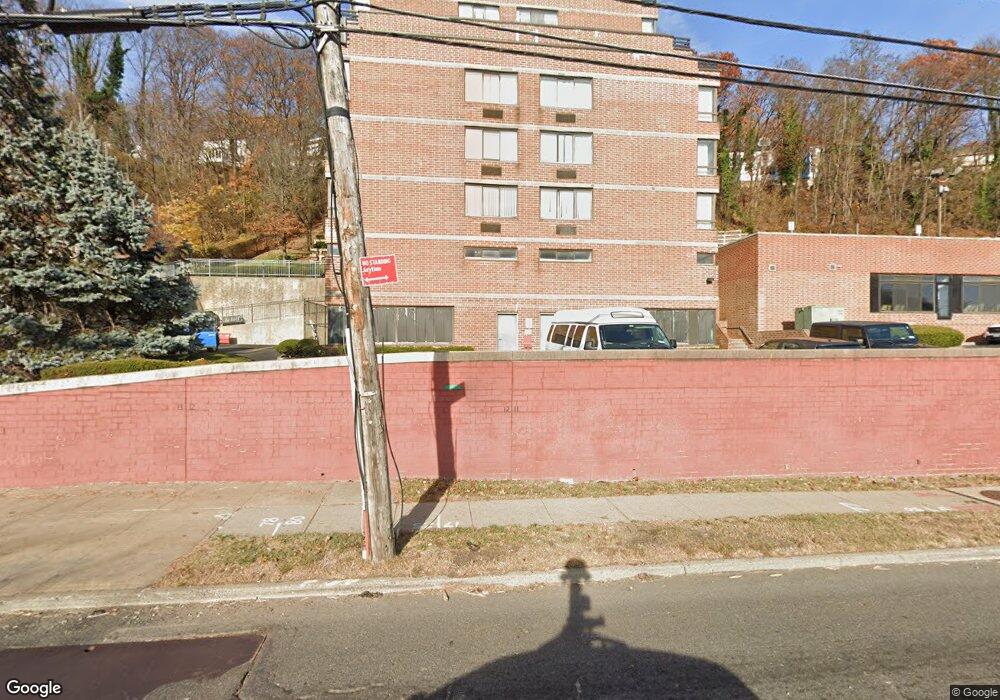
Sunrise Tower 755 Narrows Rd N Unit 1211 Staten Island, NY 10304
Grymes Hill NeighborhoodEstimated Value: $355,920 - $470,000
--
Bed
--
Bath
933
Sq Ft
$448/Sq Ft
Est. Value
About This Home
This home is located at 755 Narrows Rd N Unit 1211, Staten Island, NY 10304 and is currently estimated at $418,230, approximately $448 per square foot. 755 Narrows Rd N Unit 1211 is a home located in Richmond County with nearby schools including P.S. 35 The Clove Valley School, Intermediate School 27, and Curtis High School.
Ownership History
Date
Name
Owned For
Owner Type
Purchase Details
Closed on
Apr 28, 2006
Sold by
Laperna Joseph J
Bought by
Brenner Linda
Current Estimated Value
Home Financials for this Owner
Home Financials are based on the most recent Mortgage that was taken out on this home.
Original Mortgage
$155,000
Outstanding Balance
$89,769
Interest Rate
6.4%
Mortgage Type
Fannie Mae Freddie Mac
Estimated Equity
$328,461
Purchase Details
Closed on
Dec 30, 2003
Sold by
Laperna Salvatore J and Laperna Josephine
Bought by
Laperna Joseph J
Purchase Details
Closed on
Aug 14, 2000
Sold by
Hession Richard J
Bought by
Laperna Salvatore J and Laperna Josephine
Purchase Details
Closed on
Jul 6, 1998
Sold by
Giunta Luigi Michael and Giunta Carmelo Anthony
Bought by
Hession Richard J
Create a Home Valuation Report for This Property
The Home Valuation Report is an in-depth analysis detailing your home's value as well as a comparison with similar homes in the area
Home Values in the Area
Average Home Value in this Area
Purchase History
| Date | Buyer | Sale Price | Title Company |
|---|---|---|---|
| Brenner Linda | $340,000 | Fidelity National Title Insu | |
| Laperna Joseph J | -- | Fidelity National Title Insu | |
| Laperna Salvatore J | $115,000 | Fidelity National Title Ins | |
| Hession Richard J | $90,000 | Nations Title Insurance |
Source: Public Records
Mortgage History
| Date | Status | Borrower | Loan Amount |
|---|---|---|---|
| Open | Brenner Linda | $155,000 |
Source: Public Records
Tax History Compared to Growth
Tax History
| Year | Tax Paid | Tax Assessment Tax Assessment Total Assessment is a certain percentage of the fair market value that is determined by local assessors to be the total taxable value of land and additions on the property. | Land | Improvement |
|---|---|---|---|---|
| 2025 | $4,763 | $42,953 | $6,566 | $36,387 |
| 2024 | $3,440 | $41,934 | $6,566 | $35,368 |
| 2023 | $3,287 | $39,590 | $6,566 | $33,024 |
| 2022 | $3,211 | $40,544 | $6,566 | $33,978 |
| 2021 | $4,054 | $36,244 | $6,566 | $29,678 |
| 2020 | $2,689 | $40,680 | $6,566 | $34,114 |
| 2019 | $2,382 | $37,782 | $6,566 | $31,216 |
| 2018 | $2,880 | $39,593 | $6,566 | $33,027 |
| 2017 | $2,612 | $23,265 | $6,566 | $16,699 |
| 2016 | $2,454 | $21,399 | $6,566 | $14,833 |
| 2015 | -- | $21,869 | $6,566 | $15,303 |
| 2014 | -- | $18,731 | $6,566 | $12,165 |
Source: Public Records
About Sunrise Tower
Map
Nearby Homes
- 755 Narrows Rd N Unit 602
- 755 Narrows Rd N Unit 707
- 755 Narrows Rd N Unit 402
- 755 Narrows Rd N Unit 513A
- 755 Narrows Rd N Unit 305
- 755 Narrows Rd N Unit 501
- 755 Narrows Rd N Unit 614
- 113 Longview Rd
- 260 Douglas Rd
- 75 Longview Rd
- 55 Nicole Loop
- 239 Douglas Rd
- 1 Douglas Ct
- 850 Howard Ave Unit LJ
- 0 Douglas Rd
- 70 Cedar Terrace
- 7 Foote Ave
- 601 Richmond Rd
- 43 Ridgefield Ave
- 22 Hewitt Ave
- 755 Narrows Rd N Unit 910
- 755 Narrows Rd N Unit 907
- 755 Narrows Rd N Unit 1214A
- 755 Narrows Rd N Unit 1213
- 755 Narrows Rd N Unit 1212
- 755 Narrows Rd N Unit 1210
- 755 Narrows Rd N Unit 1209
- 755 Narrows Rd N Unit 1208
- 755 Narrows Rd N Unit 1207A
- 755 Narrows Rd N Unit 1114A
- 755 Narrows Rd N Unit 1113
- 755 Narrows Rd N Unit 1112
- 755 Narrows Rd N Unit 1111
- 755 Narrows Rd N Unit 1110
- 755 Narrows Rd N Unit 1108
- 755 Narrows Rd N Unit 1107A
- 755 Narrows Rd N Unit 1014
- 755 Narrows Rd N Unit 1013
- 755 Narrows Rd N Unit 1012
- 755 Narrows Rd N Unit 1011