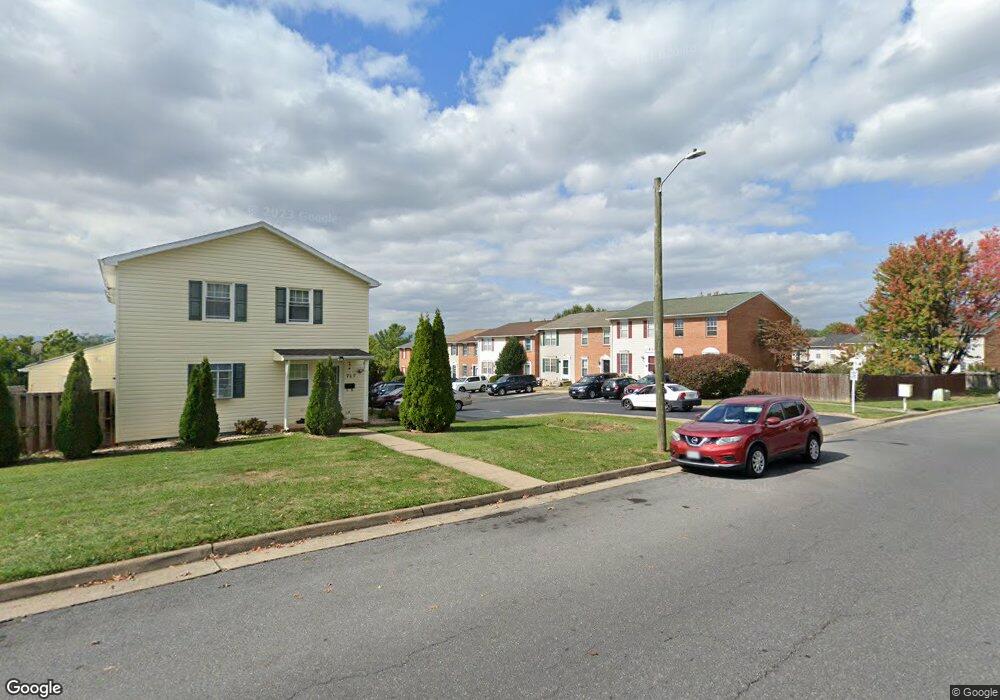
755 Northfield Ct Harrisonburg, VA 22802
Northeast Harrisonburg NeighborhoodEstimated Value: $252,000 - $284,000
4
Beds
3
Baths
1,620
Sq Ft
$162/Sq Ft
Est. Value
About This Home
This home is located at 755 Northfield Ct, Harrisonburg, VA 22802 and is currently estimated at $262,880, approximately $162 per square foot. 755 Northfield Ct is a home located in Harrisonburg City with nearby schools including Spotswood Elementary School, Skyline Middle School, and Harrisonburg High School.
Ownership History
Date
Name
Owned For
Owner Type
Purchase Details
Closed on
Aug 30, 2010
Sold by
Bland Gerald C and Bland Julia W
Bought by
Mejia Jose W
Current Estimated Value
Home Financials for this Owner
Home Financials are based on the most recent Mortgage that was taken out on this home.
Original Mortgage
$5,320
Outstanding Balance
$3,512
Interest Rate
4.51%
Mortgage Type
Stand Alone Second
Estimated Equity
$259,368
Purchase Details
Closed on
Jan 29, 2010
Sold by
Getz Kelly S
Bought by
Bland Gerald C and Bland Julia W
Purchase Details
Closed on
Jan 25, 2010
Sold by
Homesales Inc
Bought by
Getz Kelly S
Purchase Details
Closed on
Sep 4, 2009
Sold by
Bude Yohanes Aku and Bude Yohannes Aku
Bought by
Homesales Inc
Purchase Details
Closed on
Mar 20, 2007
Sold by
Lopez Carlos M and Posada Ledis M
Bought by
Bude Yohanes Akij
Home Financials for this Owner
Home Financials are based on the most recent Mortgage that was taken out on this home.
Original Mortgage
$169,125
Interest Rate
6.12%
Mortgage Type
Adjustable Rate Mortgage/ARM
Create a Home Valuation Report for This Property
The Home Valuation Report is an in-depth analysis detailing your home's value as well as a comparison with similar homes in the area
Home Values in the Area
Average Home Value in this Area
Purchase History
| Date | Buyer | Sale Price | Title Company |
|---|---|---|---|
| Mejia Jose W | -- | Main Street Title Group Llc | |
| Bland Gerald C | -- | None Available | |
| Getz Kelly S | -- | None Available | |
| Homesales Inc | $150,000 | None Available | |
| Bude Yohanes Akij | -- | Blue Maple Title |
Source: Public Records
Mortgage History
| Date | Status | Borrower | Loan Amount |
|---|---|---|---|
| Open | Mejia Jose W | $5,320 | |
| Open | Mejia Jose W | $149,949 | |
| Previous Owner | Bude Yohanes Akij | $169,125 |
Source: Public Records
Tax History Compared to Growth
Tax History
| Year | Tax Paid | Tax Assessment Tax Assessment Total Assessment is a certain percentage of the fair market value that is determined by local assessors to be the total taxable value of land and additions on the property. | Land | Improvement |
|---|---|---|---|---|
| 2025 | $2,111 | $234,300 | $36,800 | $197,500 |
| 2024 | $2,111 | $209,000 | $35,200 | $173,800 |
| 2023 | $1,867 | $194,500 | $35,000 | $159,500 |
| 2022 | $1,513 | $162,700 | $32,000 | $130,700 |
| 2021 | $1,308 | $145,300 | $30,000 | $115,300 |
| 2020 | $1,250 | $143,900 | $30,000 | $113,900 |
| 2019 | $1,230 | $141,600 | $30,000 | $111,600 |
| 2018 | $991 | $140,200 | $30,000 | $110,200 |
| 2017 | $991 | $138,100 | $30,000 | $108,100 |
| 2016 | $991 | $138,100 | $30,000 | $108,100 |
| 2015 | $991 | $137,700 | $30,000 | $107,700 |
| 2014 | $928 | $134,500 | $30,000 | $104,500 |
Source: Public Records
Map
Nearby Homes
- 757 Northfield Ct
- 753 Northfield Ct
- 759 Northfield Ct
- 751 Northfield Ct
- 761 Northfield Ct
- 749 Northfield Ct
- 763 Northfield Ct
- 765 Northfield Ct
- 735 Northfield Ct
- 739 Northfield Ct
- 767 Northfield Ct
- 733 Northfield Ct
- 741 Northfield Ct
- 731 Northfield Ct
- 743 Northfield Ct
- 729 Northfield Ct
- 745 Northfield Ct
- 727 Northfield Ct
- 815 Northfield Ct
- 813 Northfield Ct