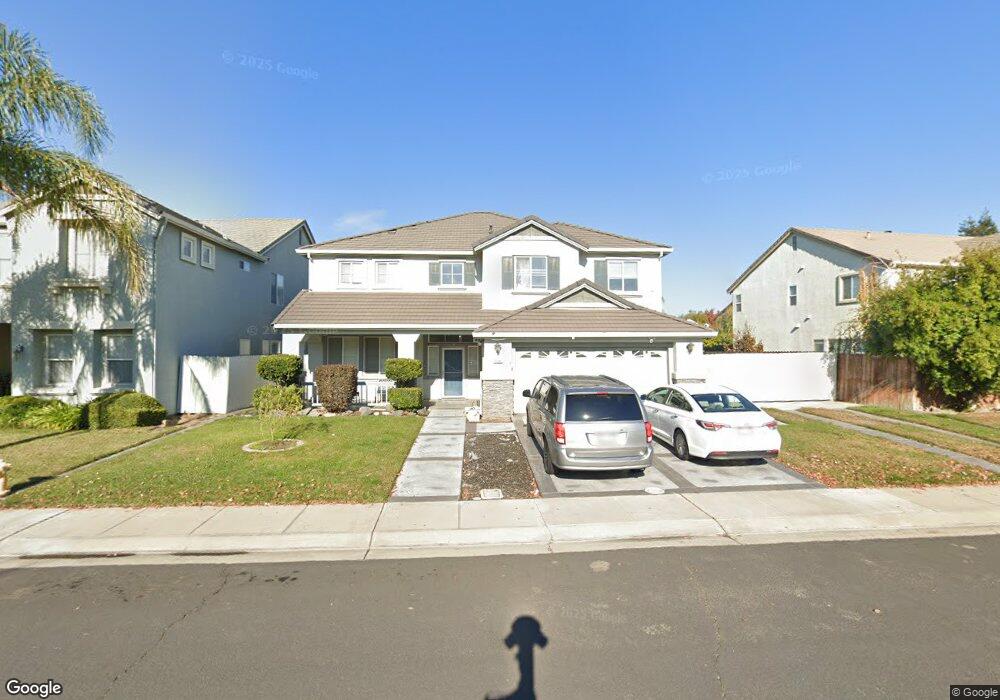
755 Randall Way Manteca, CA 95337
Estimated Value: $673,000 - $753,000
3
Beds
3
Baths
3,157
Sq Ft
$228/Sq Ft
Est. Value
About This Home
This home is located at 755 Randall Way, Manteca, CA 95337 and is currently estimated at $718,492, approximately $227 per square foot. 755 Randall Way is a home located in San Joaquin County with nearby schools including Walter Woodward Elementary School and Manteca High School.
Ownership History
Date
Name
Owned For
Owner Type
Purchase Details
Closed on
Feb 1, 2010
Sold by
Brown Dennis D and Brown Lisa M
Bought by
Sherer Randall L and Sherer Jamie L
Current Estimated Value
Home Financials for this Owner
Home Financials are based on the most recent Mortgage that was taken out on this home.
Original Mortgage
$215,710
Outstanding Balance
$144,326
Interest Rate
5.25%
Mortgage Type
FHA
Estimated Equity
$574,166
Purchase Details
Closed on
Jul 27, 2000
Sold by
Woodward Park Development Co Llc
Bought by
Brown Dennis D and Brown Lisa M
Home Financials for this Owner
Home Financials are based on the most recent Mortgage that was taken out on this home.
Original Mortgage
$247,150
Interest Rate
8.2%
Create a Home Valuation Report for This Property
The Home Valuation Report is an in-depth analysis detailing your home's value as well as a comparison with similar homes in the area
Purchase History
We collect this data history from publicly available records. To have your information removed, we recommend requesting removal directly through your county’s website.
| Date | Buyer | Sale Price | Title Company |
|---|---|---|---|
| Sherer Randall L | $265,000 | Old Republic Title Company | |
| Brown Dennis D | $260,500 | Central Valley Title Company |
Source: Public Records
Mortgage History
We collect this data history from publicly available records. To have your information removed, we recommend requesting removal directly through your county’s website.
| Date | Status | Borrower | Loan Amount |
|---|---|---|---|
| Open | Sherer Randall L | $215,710 | |
| Previous Owner | Brown Dennis D | $247,150 |
Source: Public Records
Tax History
| Year | Tax Paid | Tax Assessment Tax Assessment Total Assessment is a certain percentage of the fair market value that is determined by local assessors to be the total taxable value of land and additions on the property. | Land | Improvement |
|---|---|---|---|---|
| 2025 | $4,624 | $342,051 | $85,189 | $256,862 |
| 2024 | $4,517 | $335,345 | $83,519 | $251,826 |
| 2023 | $4,472 | $328,771 | $81,882 | $246,889 |
| 2022 | $4,412 | $322,326 | $80,277 | $242,049 |
| 2021 | $4,372 | $316,006 | $78,703 | $237,303 |
| 2020 | $4,226 | $312,766 | $77,896 | $234,870 |
| 2019 | $4,180 | $306,634 | $76,369 | $230,265 |
| 2018 | $4,130 | $300,622 | $74,872 | $225,750 |
| 2017 | $4,089 | $294,728 | $73,404 | $221,324 |
| 2016 | $4,019 | $288,951 | $71,965 | $216,986 |
| 2014 | $3,799 | $279,040 | $69,497 | $209,543 |
Source: Public Records
Map
Nearby Homes
- 2232 Katherine Place
- 2317 Mathar Dr
- 655 Mono St
- 2364 Inyo Place
- 870 Storybook St
- 277 Fragrance St
- 250 Fragrance St
- 2135 Fountain Square Ave
- 2187 Fountain Square Ave
- 1773 Lana Way
- 864 Grafton St
- 763 Grafton St
- 164 Legacy St
- 131 Legacy St
- 119 Legacy St
- 1849 Birdie Ave
- 1543 Garold Ln
- 175 Feverfew St
- 1094 Danilo Ct
- 1175 Miel St
- 726 Randall Way
- 738 Randall Way
- 2108 Buena Vista Dr
- 2116 Buena Vista Dr
- 721 Amy Way
- 746 Randall Way
- 733 Amy Way
- 2128 Buena Vista Dr
- 731 Randall Way
- 725 Randall Way
- 739 Randall Way
- 717 Randall Way
- 739 Amy Way
- 752 Randall Way
- 747 Randall Way
- 709 Randall Way
- 751 Amy Way
- 738 Dody Dr
- 746 Dody Dr
- 720 Amy Way
Your Personal Tour Guide
Ask me questions while you tour the home.