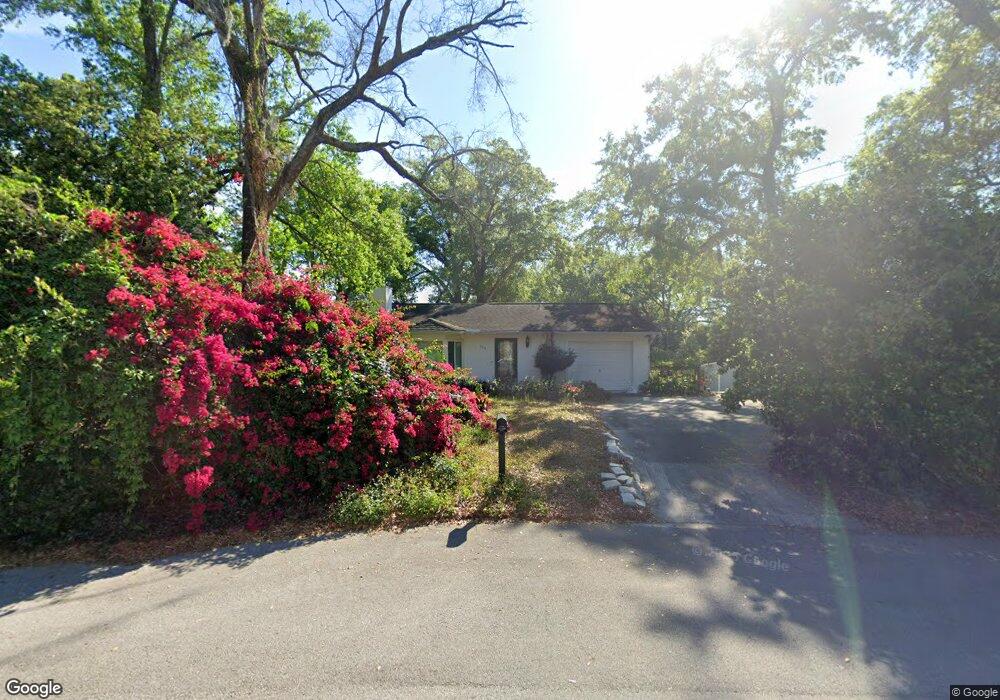
755 Raymond Ave Altamonte Springs, FL 32701
Estimated Value: $324,421 - $533,000
3
Beds
2
Baths
1,432
Sq Ft
$276/Sq Ft
Est. Value
About This Home
This home is located at 755 Raymond Ave, Altamonte Springs, FL 32701 and is currently estimated at $394,605, approximately $275 per square foot. 755 Raymond Ave is a home located in Seminole County with nearby schools including Altamonte Elementary School, Lyman High School, and Milwee Middle School.
Ownership History
Date
Name
Owned For
Owner Type
Purchase Details
Closed on
Feb 5, 2025
Sold by
Kintigh Dawn D
Bought by
Dawn Dorene Kintigh Revocable Living Trust and Kintigh
Current Estimated Value
Purchase Details
Closed on
Apr 6, 2015
Sold by
Trombo Gregory J
Bought by
Kintigh Dawn D
Home Financials for this Owner
Home Financials are based on the most recent Mortgage that was taken out on this home.
Original Mortgage
$109,410
Interest Rate
3.77%
Mortgage Type
New Conventional
Purchase Details
Closed on
Apr 1, 2015
Bought by
Kintigh Dawn D
Home Financials for this Owner
Home Financials are based on the most recent Mortgage that was taken out on this home.
Original Mortgage
$109,410
Interest Rate
3.77%
Mortgage Type
New Conventional
Purchase Details
Closed on
Mar 1, 1993
Bought by
Kintigh Dawn D
Purchase Details
Closed on
Apr 1, 1980
Bought by
Kintigh Dawn D
Purchase Details
Closed on
Oct 1, 1979
Bought by
Kintigh Dawn D
Create a Home Valuation Report for This Property
The Home Valuation Report is an in-depth analysis detailing your home's value as well as a comparison with similar homes in the area
Home Values in the Area
Average Home Value in this Area
Purchase History
| Date | Buyer | Sale Price | Title Company |
|---|---|---|---|
| Dawn Dorene Kintigh Revocable Living Trust | $100 | None Listed On Document | |
| Kintigh Dawn D | -- | Mortgagee Title Services Inc | |
| Kintigh Dawn D | $100 | -- | |
| Kintigh Dawn D | $73,000 | -- | |
| Kintigh Dawn D | $59,000 | -- | |
| Kintigh Dawn D | $9,000 | -- |
Source: Public Records
Mortgage History
| Date | Status | Borrower | Loan Amount |
|---|---|---|---|
| Previous Owner | Kintigh Dawn D | $109,410 |
Source: Public Records
Tax History Compared to Growth
Tax History
| Year | Tax Paid | Tax Assessment Tax Assessment Total Assessment is a certain percentage of the fair market value that is determined by local assessors to be the total taxable value of land and additions on the property. | Land | Improvement |
|---|---|---|---|---|
| 2024 | $1,810 | $153,716 | -- | -- |
| 2023 | $1,763 | $149,239 | $0 | $0 |
| 2021 | $1,639 | $140,672 | $0 | $0 |
| 2020 | $1,621 | $138,730 | $0 | $0 |
| 2019 | $1,606 | $135,611 | $0 | $0 |
| 2018 | $1,586 | $133,082 | $0 | $0 |
| 2017 | $1,570 | $130,345 | $0 | $0 |
| 2016 | $1,585 | $128,558 | $0 | $0 |
| 2015 | $976 | $100,919 | $0 | $0 |
| 2014 | $976 | $100,118 | $0 | $0 |
Source: Public Records
Map
Nearby Homes
- 234 Alpine St
- 135 E Citrus St
- 256 Alpine St
- 213 Egret Ct
- 155 Hidden Woods Cove
- 216 Egret Ct
- 971 Blackwood St
- 620 Cranes Way Unit 207
- 900 Red Fox Rd
- 495 Howard Ave
- 940 Douglas Ave Unit 145
- 940 Douglas Ave Unit 159
- 570 Cranes Way Unit 246
- 570 Cranes Way Unit 248
- 913 Red Fox Rd
- 1823 North St
- 520 Cranes Way Unit 202
- 412 E Orange St
- 510 Cranes Way Unit 105
- 450 Andrews Dr
- 203 Heron St
- 205 Heron St
- 205 Heron St Unit .
- 207 Heron St
- 201 Heron St
- 204 Alpine St
- 209 Heron St
- 211 Heron St
- 159 Raymond Oaks Ct
- 213 E Hillcrest St
- 210 E Alpine St
- 213 Heron St
- 213 Street
- 215 Heron St
- 160 Raymond Oaks Ct
- 201 Alpine St
- 205 Alpine St
- 217 Heron St
- 734 Sea Gull Ave
- 170 E Hillcrest St