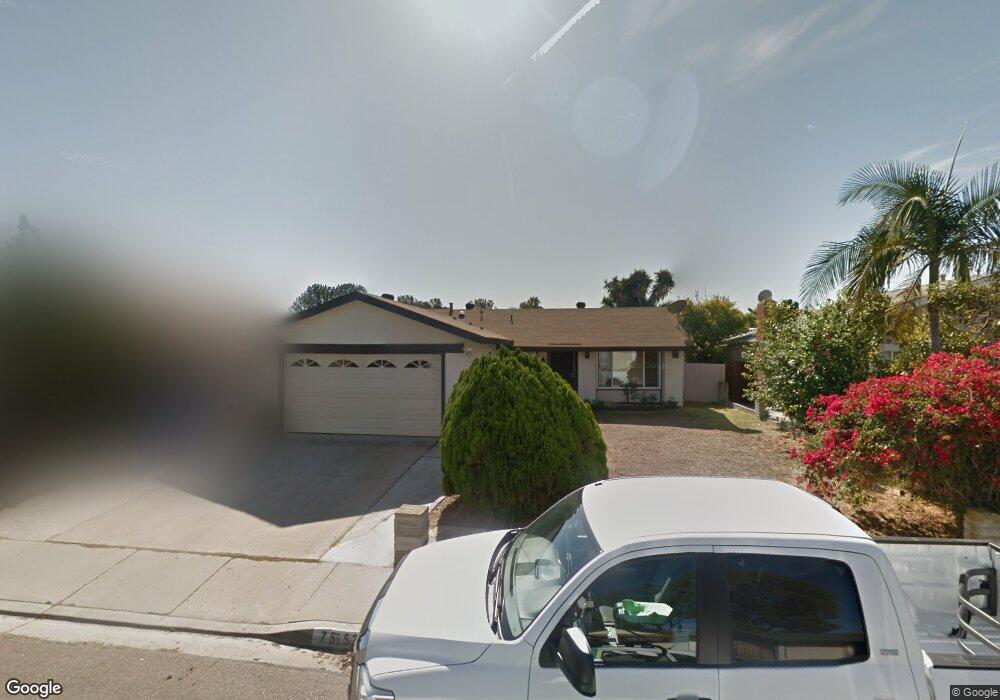
7553 Windsong Rd San Diego, CA 92126
Mira Mesa NeighborhoodEstimated Value: $895,000 - $1,032,000
3
Beds
2
Baths
1,134
Sq Ft
$852/Sq Ft
Est. Value
About This Home
This home is located at 7553 Windsong Rd, San Diego, CA 92126 and is currently estimated at $965,657, approximately $851 per square foot. 7553 Windsong Rd is a home located in San Diego County with nearby schools including Hickman Elementary School, Challenger Middle School, and Mira Mesa High School.
Ownership History
Date
Name
Owned For
Owner Type
Purchase Details
Closed on
Dec 14, 2001
Sold by
Naval Edneil Nalgan and Naval Christine Carin
Bought by
Gallardo Federico F and Gallardo Conchita C
Current Estimated Value
Home Financials for this Owner
Home Financials are based on the most recent Mortgage that was taken out on this home.
Original Mortgage
$118,275
Outstanding Balance
$46,010
Interest Rate
6.51%
Estimated Equity
$919,647
Purchase Details
Closed on
Jan 27, 1999
Sold by
Danon Keith S
Bought by
Naval Edneil Naigan and Gallardo Christine Carin
Home Financials for this Owner
Home Financials are based on the most recent Mortgage that was taken out on this home.
Original Mortgage
$127,600
Interest Rate
6.79%
Purchase Details
Closed on
Jan 26, 1999
Sold by
Gallardo Conchita
Bought by
Gallardo Federico
Home Financials for this Owner
Home Financials are based on the most recent Mortgage that was taken out on this home.
Original Mortgage
$127,600
Interest Rate
6.79%
Create a Home Valuation Report for This Property
The Home Valuation Report is an in-depth analysis detailing your home's value as well as a comparison with similar homes in the area
Home Values in the Area
Average Home Value in this Area
Purchase History
| Date | Buyer | Sale Price | Title Company |
|---|---|---|---|
| Gallardo Federico F | $124,500 | Lawyers Title Company | |
| Naval Edneil Naigan | $159,500 | First American Title Ins Co | |
| Gallardo Federico | -- | First American Title |
Source: Public Records
Mortgage History
| Date | Status | Borrower | Loan Amount |
|---|---|---|---|
| Open | Gallardo Federico F | $118,275 | |
| Previous Owner | Naval Edneil Naigan | $127,600 |
Source: Public Records
Tax History Compared to Growth
Tax History
| Year | Tax Paid | Tax Assessment Tax Assessment Total Assessment is a certain percentage of the fair market value that is determined by local assessors to be the total taxable value of land and additions on the property. | Land | Improvement |
|---|---|---|---|---|
| 2025 | $3,063 | $250,028 | $156,761 | $93,267 |
| 2024 | $3,063 | $245,127 | $153,688 | $91,439 |
| 2023 | $2,995 | $240,322 | $150,675 | $89,647 |
| 2022 | $2,914 | $235,611 | $147,721 | $87,890 |
| 2021 | $2,894 | $230,992 | $144,825 | $86,167 |
| 2020 | $2,859 | $228,624 | $143,340 | $85,284 |
| 2019 | $2,808 | $224,142 | $140,530 | $83,612 |
| 2018 | $2,627 | $219,748 | $137,775 | $81,973 |
| 2017 | $2,561 | $215,440 | $135,074 | $80,366 |
| 2016 | $2,520 | $211,217 | $132,426 | $78,791 |
| 2015 | $2,483 | $208,045 | $130,437 | $77,608 |
| 2014 | $2,445 | $203,970 | $127,882 | $76,088 |
Source: Public Records
Map
Nearby Homes
- 7561 Windsong Rd
- 7387 New Salem St
- 7736 Alcamo Rd
- 10692 Dabney Dr Unit 102
- 10785 Chinon Cir
- 10668 Dabney Dr Unit 122
- 10668 Dabney Dr Unit 125
- 10774 Dabney Dr Unit 20
- 7684 Adkins Way
- 10606 Aderman Ave Unit 5
- 8007 New Salem St
- 10646 Aderman Ave Unit 21
- 10740 Aderman Ave Unit 66
- 7385 Calle Cristobal Unit 225
- 7365 Calle Cristobal Unit 197
- 7349 Calle Cristobal Unit 181
- 7444 Mason Heights Ln
- 10840 New Salem Point
- 7220 Calle Cristobal Unit 12
- 10628 Kemerton Rd
- 7545 Windsong Rd
- 10896 New Salem Cove Unit 16
- 7537 Windsong Rd
- 7569 Windsong Rd
- 10888 New Salem Cove
- 10895 New Salem Cove
- 7554 Windsong Rd
- 10915 Barbados Way
- 7577 Windsong Rd
- 7562 Windsong Rd
- 7529 Windsong Rd
- 7546 Windsong Rd
- 7570 Windsong Rd
- 7538 Windsong Rd
- 10911 Barbados Way
- 10880 New Salem Cove
- 7578 Windsong Rd
- 7585 Windsong Rd
- 10885 New Salem Cove
- 7530 Windsong Rd