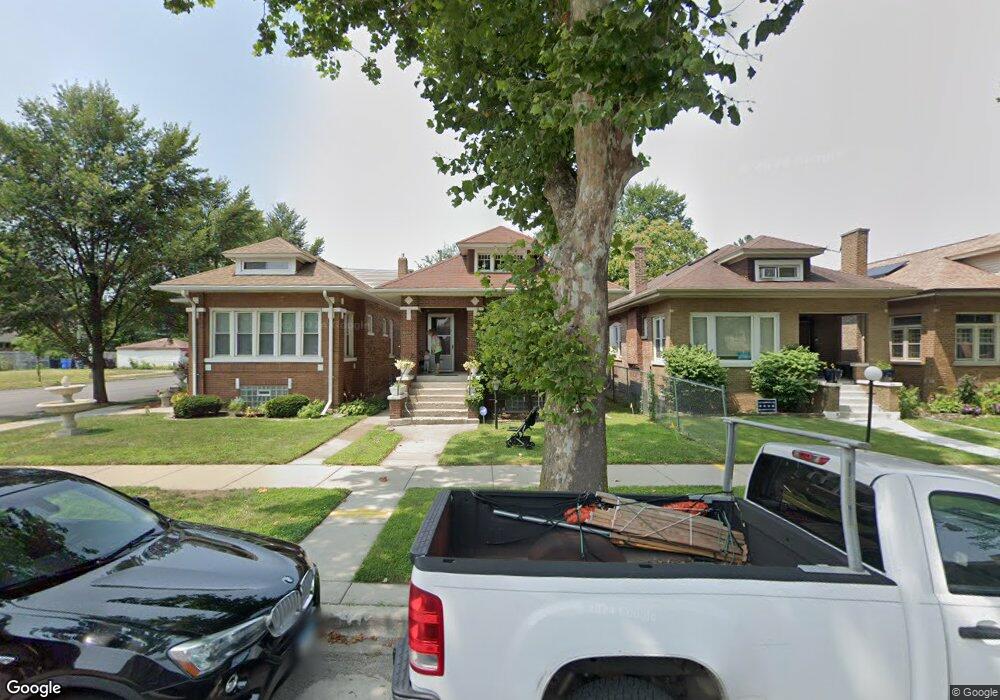
7556 S Cregier Ave Chicago, IL 60649
South Shore NeighborhoodEstimated Value: $209,351 - $311,000
4
Beds
2
Baths
1,265
Sq Ft
$192/Sq Ft
Est. Value
About This Home
This home is located at 7556 S Cregier Ave, Chicago, IL 60649 and is currently estimated at $243,338, approximately $192 per square foot. 7556 S Cregier Ave is a home located in Cook County with nearby schools including Bouchet Elementary Math & Science Academy, St Paul Lutheran School, and Muhammad University.
Ownership History
Date
Name
Owned For
Owner Type
Purchase Details
Closed on
Apr 6, 2021
Sold by
Hubbard William Edward and Us Bank National Association
Bought by
Black Sea Investment Group Llc
Current Estimated Value
Purchase Details
Closed on
Oct 18, 2017
Sold by
Henry Bettye
Bought by
Hubbard William Edward
Home Financials for this Owner
Home Financials are based on the most recent Mortgage that was taken out on this home.
Original Mortgage
$116,844
Interest Rate
4.12%
Mortgage Type
FHA
Purchase Details
Closed on
May 7, 2010
Sold by
Phillips Eugenia Y and Billups Kory
Bought by
Phillips Eugenia Y
Purchase Details
Closed on
Aug 18, 2006
Sold by
Phillips Eugenia Y
Bought by
Phillips Eugenia Y and Billups Kory
Purchase Details
Closed on
Apr 18, 2006
Sold by
Richard Orpha
Bought by
Phillips Eugenia Y
Home Financials for this Owner
Home Financials are based on the most recent Mortgage that was taken out on this home.
Original Mortgage
$205,000
Interest Rate
6.54%
Mortgage Type
Fannie Mae Freddie Mac
Create a Home Valuation Report for This Property
The Home Valuation Report is an in-depth analysis detailing your home's value as well as a comparison with similar homes in the area
Home Values in the Area
Average Home Value in this Area
Purchase History
| Date | Buyer | Sale Price | Title Company |
|---|---|---|---|
| Black Sea Investment Group Llc | $73,500 | Affinity Title | |
| Hubbard William Edward | $119,000 | None Available | |
| Phillips Eugenia Y | -- | None Available | |
| Phillips Eugenia Y | -- | None Available | |
| Phillips Eugenia Y | $205,000 | First American Title Ins Co |
Source: Public Records
Mortgage History
| Date | Status | Borrower | Loan Amount |
|---|---|---|---|
| Previous Owner | Hubbard William Edward | $116,844 | |
| Previous Owner | Phillips Eugenia Y | $205,000 |
Source: Public Records
Tax History Compared to Growth
Tax History
| Year | Tax Paid | Tax Assessment Tax Assessment Total Assessment is a certain percentage of the fair market value that is determined by local assessors to be the total taxable value of land and additions on the property. | Land | Improvement |
|---|---|---|---|---|
| 2024 | $2,329 | $12,001 | $2,858 | $9,143 |
| 2023 | $2,262 | $11,001 | $4,763 | $6,238 |
| 2022 | $2,262 | $11,001 | $4,763 | $6,238 |
| 2021 | $2,212 | $10,999 | $4,762 | $6,237 |
| 2020 | $2,693 | $12,087 | $3,429 | $8,658 |
| 2019 | $2,698 | $13,430 | $3,429 | $10,001 |
| 2018 | $2,653 | $13,430 | $3,429 | $10,001 |
| 2017 | $2,928 | $13,601 | $3,048 | $10,553 |
| 2016 | $316 | $13,601 | $3,048 | $10,553 |
| 2015 | $304 | $13,601 | $3,048 | $10,553 |
| 2014 | $301 | $12,578 | $2,667 | $9,911 |
| 2013 | $302 | $12,578 | $2,667 | $9,911 |
Source: Public Records
Map
Nearby Homes
- 7545 S Ridgeland Ave
- 7521 S Ridgeland Ave
- 7627 S Ridgeland Ave
- 7515 S East End Ave
- 1721 E 75th St
- 7637 S Ridgeland Ave
- 7650 S Cregier Ave
- 7627 S Cornell Ave
- 7631 S Cornell Ave
- 7420 S Bennett Ave
- 7730 S East End Ave
- 7743 S East End Ave
- 7345 S Bennett Ave
- 7759 S Constance Ave
- 7747 S Cornell Ave
- 7718 S Jeffery Blvd Unit GN
- 7308 S Constance Ave
- 1942 E 74th St Unit 3B
- 7517 S Chappel Ave
- 7251 S Ridgeland Ave Unit E
- 7558 S Cregier Ave
- 7550 S Cregier Ave
- 7548 S Cregier Ave
- 7544 S Cregier Ave
- 7600 S Cregier Ave
- 7542 S Cregier Ave
- 7555 S Ridgeland Ave
- 7559 S Ridgeland Ave
- 7604 S Cregier Ave
- 7538 S Cregier Ave
- 7543 S Ridgeland Ave
- 7606 S Cregier Ave
- 7534 S Cregier Ave
- 7603 S Ridgeland Ave
- 7557 S Cregier Ave
- 7553 S Cregier Ave
- 7541 S Ridgeland Ave
- 7549 S Cregier Ave
- 7610 S Cregier Ave
- 7543 S Cregier Ave