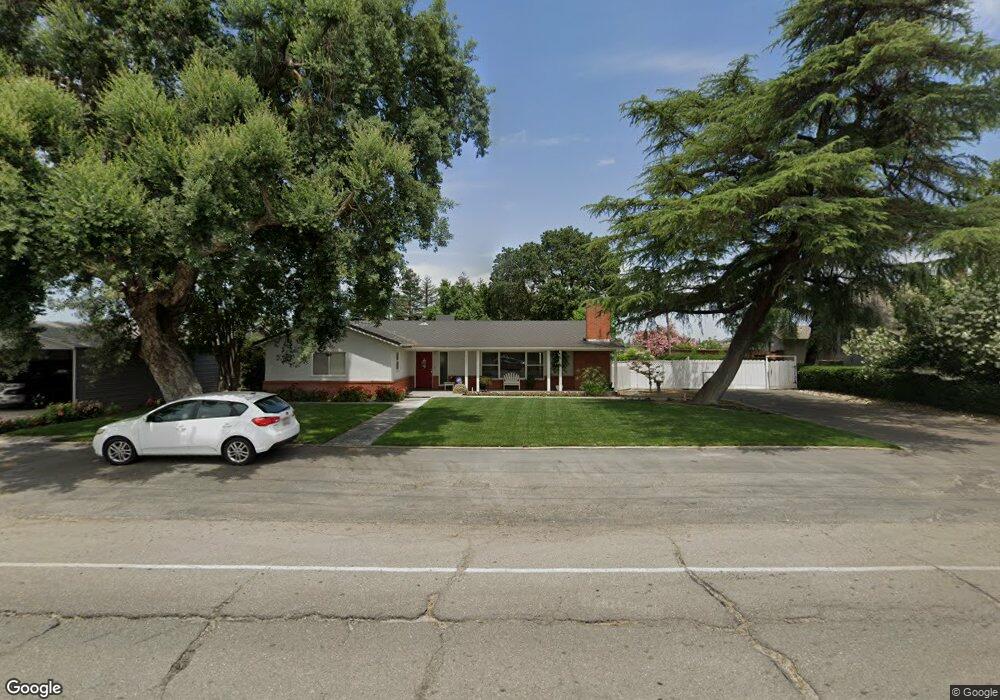
7557 E Whitmore Ave Hughson, CA 95326
Estimated Value: $480,000 - $532,222
6
Beds
2
Baths
2,080
Sq Ft
$243/Sq Ft
Est. Value
About This Home
This home is located at 7557 E Whitmore Ave, Hughson, CA 95326 and is currently estimated at $506,111, approximately $243 per square foot. 7557 E Whitmore Ave is a home located in Stanislaus County with nearby schools including Hughson Elementary School, Fox Road Elementary School, and Emilie J. Ross Middle School.
Ownership History
Date
Name
Owned For
Owner Type
Purchase Details
Closed on
Apr 4, 2008
Sold by
Lemings Sandra G
Bought by
Lemings Sandra G
Current Estimated Value
Home Financials for this Owner
Home Financials are based on the most recent Mortgage that was taken out on this home.
Original Mortgage
$140,000
Outstanding Balance
$89,440
Interest Rate
6.22%
Mortgage Type
Commercial
Estimated Equity
$416,671
Purchase Details
Closed on
Mar 15, 2000
Sold by
Scranton Daryl E Revocable Living Trust and Keith
Bought by
Lemings Randall D and Lemings Sandra G
Home Financials for this Owner
Home Financials are based on the most recent Mortgage that was taken out on this home.
Original Mortgage
$108,750
Interest Rate
10.75%
Mortgage Type
Commercial
Purchase Details
Closed on
Jun 21, 1997
Sold by
Scranton Daryl E
Bought by
Daryl E Scranton Revocable Living Trust
Create a Home Valuation Report for This Property
The Home Valuation Report is an in-depth analysis detailing your home's value as well as a comparison with similar homes in the area
Home Values in the Area
Average Home Value in this Area
Purchase History
| Date | Buyer | Sale Price | Title Company |
|---|---|---|---|
| Lemings Sandra G | -- | Financial Title Company | |
| Lemings Randall D | $145,000 | North American Title Co | |
| Daryl E Scranton Revocable Living Trust | -- | -- | |
| Daryl E Scranton Revocable Living Trust | -- | -- |
Source: Public Records
Mortgage History
| Date | Status | Borrower | Loan Amount |
|---|---|---|---|
| Open | Lemings Sandra G | $140,000 | |
| Closed | Lemings Randall D | $108,750 | |
| Closed | Lemings Randall D | $7,614 |
Source: Public Records
Tax History Compared to Growth
Tax History
| Year | Tax Paid | Tax Assessment Tax Assessment Total Assessment is a certain percentage of the fair market value that is determined by local assessors to be the total taxable value of land and additions on the property. | Land | Improvement |
|---|---|---|---|---|
| 2025 | $2,730 | $222,837 | $79,913 | $142,924 |
| 2024 | $2,569 | $218,469 | $78,347 | $140,122 |
| 2023 | $2,508 | $214,186 | $76,811 | $137,375 |
| 2022 | $2,465 | $209,987 | $75,305 | $134,682 |
| 2021 | $2,414 | $205,871 | $73,829 | $132,042 |
| 2020 | $2,378 | $203,761 | $73,072 | $130,689 |
| 2019 | $2,356 | $199,767 | $71,640 | $128,127 |
| 2018 | $2,257 | $195,851 | $70,236 | $125,615 |
| 2017 | $2,276 | $192,011 | $68,859 | $123,152 |
| 2016 | $2,152 | $188,247 | $67,509 | $120,738 |
| 2015 | $2,116 | $185,420 | $66,495 | $118,925 |
| 2014 | $2,000 | $173,500 | $86,000 | $87,500 |
Source: Public Records
Map
Nearby Homes
- 2425 7th St
- 2318 7th St
- 7306 Elm St
- 7606 Locust St
- 2142 7th St
- 2224 Province Place
- 2301 5th St
- 2100 3rd St
- 1704 San Gabriel Dr
- 6533 Narcisco Way
- 6404 Snow Beauty Way
- 6320 Snow Beauty Way
- 6304 Snow Beauty Way
- 6305 Snow Beauty Way
- 6228 Honey Haven Ln
- 6216 Honey Haven Ln
- 6208 Honey Haven Ln
- 6221 Honey Haven Ln
- 6212 Honey Haven Ln
- 6217 Honey Haven Ln
- 7555 E Whitmore Ave
- 7537 E Whitmore Ave
- 7561 E Whitmore Ave
- 7567 E Whitmore Ave
- 7601 E Whitmore Ave
- 7548 E Whitmore Ave
- 7600 E Whitmore Ave
- 7524 Pine St
- 7518 Pine St
- 7512 Pine St
- 7506 Pine St
- 7500 Pine St
- 7454 Pine St
- 7530 Pine St
- 7448 Pine St
- 7442 Pine St
- 7436 Pine St
- 7513 Pine St
- 7507 Pine St
- 7525 Pine St