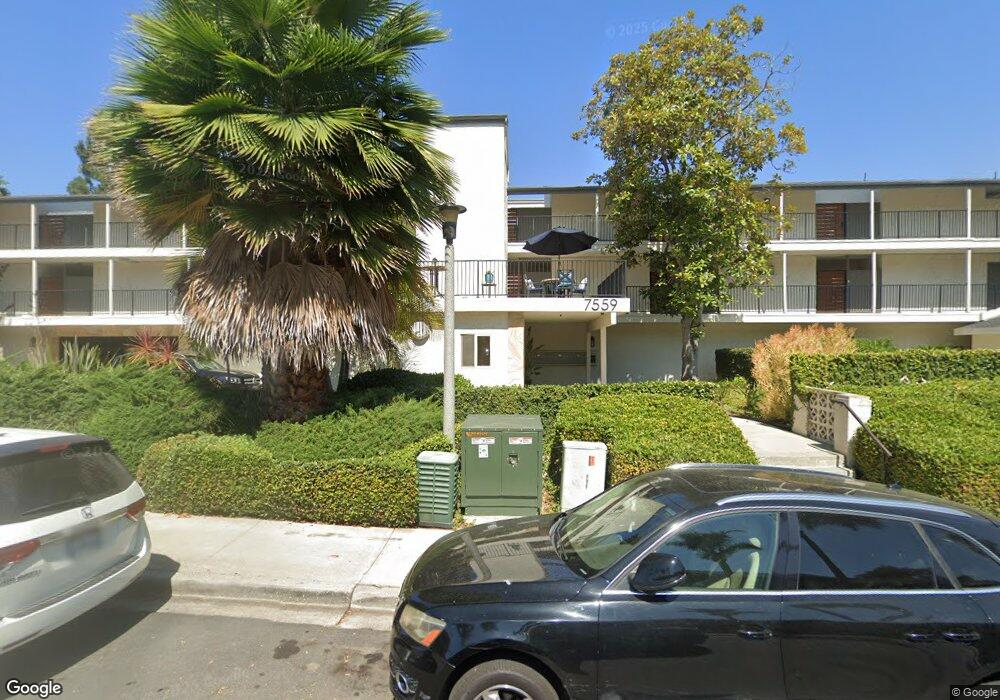
7559 Gibraltar St Unit 9 Carlsbad, CA 92009
La Costa NeighborhoodEstimated Value: $608,709 - $716,000
2
Beds
2
Baths
1,127
Sq Ft
$593/Sq Ft
Est. Value
About This Home
This home is located at 7559 Gibraltar St Unit 9, Carlsbad, CA 92009 and is currently estimated at $668,677, approximately $593 per square foot. 7559 Gibraltar St Unit 9 is a home located in San Diego County with nearby schools including La Costa Heights Elementary School, Oak Crest Middle School, and La Costa Canyon High School.
Ownership History
Date
Name
Owned For
Owner Type
Purchase Details
Closed on
Oct 17, 2007
Sold by
Skavinski Kiprian M and Skavinski Barbara H
Bought by
Skavinski Kiprian M and Skavinski Barbara H
Current Estimated Value
Purchase Details
Closed on
Jul 30, 2001
Sold by
Mckinsey Dianna
Bought by
Skavinski Kiprian M and Skavinski Barbara H
Home Financials for this Owner
Home Financials are based on the most recent Mortgage that was taken out on this home.
Original Mortgage
$202,400
Outstanding Balance
$79,181
Interest Rate
7.19%
Estimated Equity
$589,496
Purchase Details
Closed on
Sep 15, 1999
Sold by
Dome Gregory A
Bought by
Mckinsey Dianna
Purchase Details
Closed on
Jan 15, 1988
Create a Home Valuation Report for This Property
The Home Valuation Report is an in-depth analysis detailing your home's value as well as a comparison with similar homes in the area
Home Values in the Area
Average Home Value in this Area
Purchase History
| Date | Buyer | Sale Price | Title Company |
|---|---|---|---|
| Skavinski Kiprian M | -- | None Available | |
| Skavinski Kiprian M | $225,000 | Fidelity National Title Co | |
| Mckinsey Dianna | -- | -- | |
| -- | $90,000 | -- |
Source: Public Records
Mortgage History
| Date | Status | Borrower | Loan Amount |
|---|---|---|---|
| Open | Skavinski Kiprian M | $202,400 |
Source: Public Records
Tax History
| Year | Tax Paid | Tax Assessment Tax Assessment Total Assessment is a certain percentage of the fair market value that is determined by local assessors to be the total taxable value of land and additions on the property. | Land | Improvement |
|---|---|---|---|---|
| 2025 | $3,930 | $332,219 | $80,490 | $251,729 |
| 2024 | $3,930 | $325,706 | $78,912 | $246,794 |
| 2023 | $3,791 | $319,320 | $77,365 | $241,955 |
| 2022 | $3,682 | $313,060 | $75,849 | $237,211 |
| 2021 | $3,603 | $306,922 | $74,362 | $232,560 |
| 2020 | $3,528 | $303,776 | $73,600 | $230,176 |
| 2019 | $3,461 | $297,820 | $72,157 | $225,663 |
| 2018 | $3,398 | $291,982 | $70,743 | $221,239 |
| 2017 | $90 | $286,257 | $69,356 | $216,901 |
| 2016 | $3,243 | $280,646 | $67,997 | $212,649 |
| 2015 | $3,170 | $276,431 | $66,976 | $209,455 |
| 2014 | $3,085 | $271,018 | $65,665 | $205,353 |
Source: Public Records
Map
Nearby Homes
- 7559 Gibraltar St Unit 16
- 7526 Jerez Ct
- 7538 Gibraltar St Unit D
- 3004 La Costa Ave Unit B
- 2625 Pirineos Way Unit 219
- 2607 Pirineos Way Unit 116
- 2644 La Costa Ave
- 2955 Avenida Valera
- 2556 Navarra Dr Unit C
- 2544 Navarra Dr Unit 4
- 2544 Navarra Dr Unit 12
- 2537 Navarra Dr Unit 9B
- 2556 La Costa Ave
- 2534 Navarra Dr Unit B
- 2904 Levante St
- 2524 La Costa Ave
- 2606 Galicia Way
- 2927 Levante St
- 2517 Navarra Dr Unit 1B
- 2904 Avenida Valera
- 7559 Gibraltar St Unit 5
- 7559 Gibraltar St Unit 15
- 7559 Gibraltar St Unit 14
- 7559 Gibraltar St Unit 13
- 7559 Gibraltar St Unit 12
- 7559 Gibraltar St Unit 11
- 7559 Gibraltar St Unit 10
- 7559 Gibraltar St Unit 8
- 7559 Gibraltar St Unit 6
- 7559 Gibraltar St Unit 4
- 7559 Gibraltar St Unit 2
- 7559 Gibraltar St Unit 1
- 400 Gibraltar St Unit 400
- 7563 Gibraltar St Unit 24
- 7563 Gibraltar St Unit 23
- 7563 Gibraltar St Unit 22
- 7563 Gibraltar St Unit 21
- 7547 Gibraltar St Unit 302
- 7547 Gibraltar St Unit 301
- 7547 Gibraltar St Unit 300
Your Personal Tour Guide
Ask me questions while you tour the home.