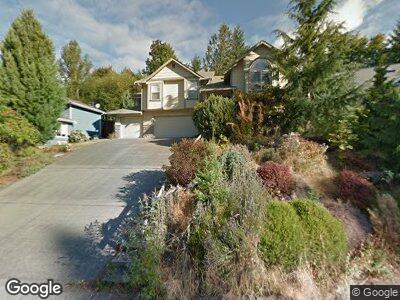
756 Cedar Creek Ln Bellingham, WA 98229
Estimated Value: $919,000 - $1,077,000
3
Beds
3
Baths
2,457
Sq Ft
$402/Sq Ft
Est. Value
About This Home
This home is located at 756 Cedar Creek Ln, Bellingham, WA 98229 and is currently estimated at $988,051, approximately $402 per square foot. 756 Cedar Creek Ln is a home located in Whatcom County with nearby schools including Wade King Elementary School, Fairhaven Middle School, and Sehome High School.
Ownership History
Date
Name
Owned For
Owner Type
Purchase Details
Closed on
Sep 3, 2005
Sold by
Ford Greg R and Ford Leslie A
Bought by
Omalley Noah T and Omalley Kristin A
Current Estimated Value
Home Financials for this Owner
Home Financials are based on the most recent Mortgage that was taken out on this home.
Original Mortgage
$265,000
Outstanding Balance
$145,577
Interest Rate
5.7%
Mortgage Type
Fannie Mae Freddie Mac
Estimated Equity
$818,167
Purchase Details
Closed on
Nov 18, 1999
Sold by
D & L Construction
Bought by
Ford Greg R and Ford Leslie A
Home Financials for this Owner
Home Financials are based on the most recent Mortgage that was taken out on this home.
Original Mortgage
$190,800
Interest Rate
6.87%
Purchase Details
Closed on
Jul 7, 1999
Sold by
Sandvig Enterprises Llc
Bought by
D & L Construction
Create a Home Valuation Report for This Property
The Home Valuation Report is an in-depth analysis detailing your home's value as well as a comparison with similar homes in the area
Home Values in the Area
Average Home Value in this Area
Purchase History
| Date | Buyer | Sale Price | Title Company |
|---|---|---|---|
| Omalley Noah T | $425,280 | Whatcom Land Title | |
| Ford Greg R | $186,384 | Chicago Title Insurance Co | |
| D & L Construction | -- | Island Title Company |
Source: Public Records
Mortgage History
| Date | Status | Borrower | Loan Amount |
|---|---|---|---|
| Closed | Omalley Kristin A | $22,000 | |
| Open | Omalley Noah T | $265,000 | |
| Previous Owner | Ford Greg R | $190,800 |
Source: Public Records
Tax History Compared to Growth
Tax History
| Year | Tax Paid | Tax Assessment Tax Assessment Total Assessment is a certain percentage of the fair market value that is determined by local assessors to be the total taxable value of land and additions on the property. | Land | Improvement |
|---|---|---|---|---|
| 2024 | $7,512 | $866,093 | $278,751 | $587,342 |
| 2023 | $7,512 | $897,058 | $288,717 | $608,341 |
| 2022 | $6,473 | $763,458 | $245,718 | $517,740 |
| 2021 | $5,768 | $615,708 | $198,165 | $417,543 |
| 2020 | $5,646 | $540,091 | $173,828 | $366,263 |
| 2019 | $5,428 | $512,663 | $165,000 | $347,663 |
| 2018 | $5,656 | $494,597 | $148,949 | $345,648 |
| 2017 | $4,996 | $439,025 | $132,211 | $306,814 |
| 2016 | $4,524 | $404,344 | $121,651 | $282,693 |
| 2015 | $4,441 | $383,536 | $115,315 | $268,221 |
| 2014 | -- | $365,261 | $109,824 | $255,437 |
| 2013 | -- | $346,806 | $105,600 | $241,206 |
Source: Public Records
Map
Nearby Homes
- 4334 Samish Crest Dr
- 1934 N Colby Ct
- 4204 Harrison St
- 2612 S 42nd St
- 4915 Samish Way Unit 16
- 4915 Samish Way Unit 78
- 2604 S 42nd St
- 2500 Samish Way Unit 42
- 2600 42nd
- 4214 Samish Crest Dr
- 2608 S 42nd St
- 2014 39th St
- 1800 40th Place
- 750 Samish Way
- 4949 Samish Way Unit 6
- 4949 Samish Way Unit 17
- 4949 Samish Way Unit 45
- 0 Wildwood Dr Unit NWM2316576
- 2284 Yew Street Rd Unit A5
- 2284 Yew Street Rd Unit B6
- 756 Cedar Creek Ln
- 736 Cedar Creek Ln
- 766 Cedar Creek Ln
- 744 Cedar Creek Ln
- 726 Cedar Creek Ln
- 757 Cedar Creek Ln
- 737 Cedar Creek Ln
- 767 Cedar Creek Ln
- 716 Cedar Creek Ln
- 773 Cedar Creek Ln
- 727 Cedar Creek Ln
- 717 Cedar Creek Ln
- 706 Cedar Creek Ln
- 0 48th St Unit 1341104
- 0 48th St Unit 246227
- 0 48th St Unit 773165
- 0 48th St Unit NWM98903907
- 1919 Governor Rd
- 765 Governor Place
- 707 Cedar Creek Ln