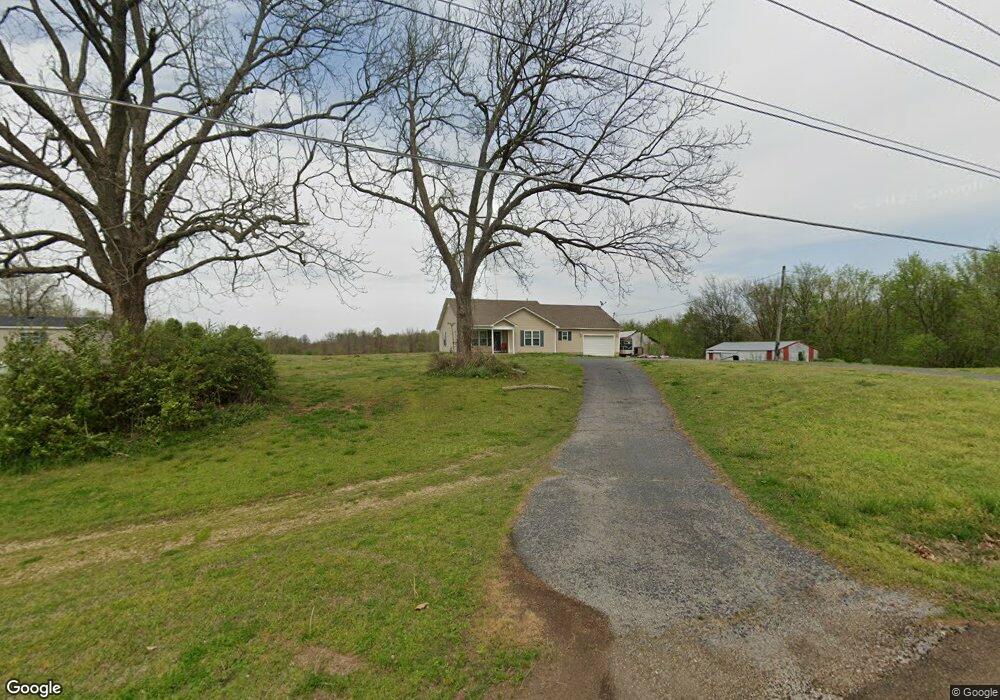
756 Central Curve Rd Ripley, TN 38063
Estimated Value: $153,000 - $186,330
--
Bed
1
Bath
1,092
Sq Ft
$154/Sq Ft
Est. Value
About This Home
This home is located at 756 Central Curve Rd, Ripley, TN 38063 and is currently estimated at $168,443, approximately $154 per square foot. 756 Central Curve Rd is a home located in Lauderdale County with nearby schools including Ripley Primary School, Ripley Elementary School, and Ripley Middle School.
Ownership History
Date
Name
Owned For
Owner Type
Purchase Details
Closed on
Dec 1, 2016
Sold by
Gray James C and Gray Billie J
Bought by
Gray Billie Jane
Current Estimated Value
Purchase Details
Closed on
Mar 13, 2000
Sold by
Chipman W L W and Chipman Janie
Bought by
Jean Gray and Jean Billie
Purchase Details
Closed on
Jan 19, 1970
Bought by
Chipman Chipman W and Chipman Janie
Create a Home Valuation Report for This Property
The Home Valuation Report is an in-depth analysis detailing your home's value as well as a comparison with similar homes in the area
Home Values in the Area
Average Home Value in this Area
Purchase History
| Date | Buyer | Sale Price | Title Company |
|---|---|---|---|
| Gray Billie Jane | -- | -- | |
| Jean Gray | -- | -- | |
| Chipman Chipman W | -- | -- |
Source: Public Records
Tax History Compared to Growth
Tax History
| Year | Tax Paid | Tax Assessment Tax Assessment Total Assessment is a certain percentage of the fair market value that is determined by local assessors to be the total taxable value of land and additions on the property. | Land | Improvement |
|---|---|---|---|---|
| 2024 | $696 | $27,400 | $10,625 | $16,775 |
| 2023 | $696 | $27,400 | $10,625 | $16,775 |
| 2022 | $696 | $27,400 | $10,625 | $16,775 |
| 2021 | $696 | $27,400 | $10,625 | $16,775 |
| 2020 | $687 | $27,400 | $10,625 | $16,775 |
| 2019 | $687 | $23,250 | $8,575 | $14,675 |
| 2018 | $687 | $23,250 | $8,575 | $14,675 |
| 2017 | $1,140 | $50,625 | $8,575 | $42,050 |
| 2016 | $656 | $22,050 | $7,675 | $14,375 |
| 2015 | $707 | $22,050 | $7,675 | $14,375 |
| 2014 | $707 | $24,375 | $6,950 | $17,425 |
Source: Public Records
Map
Nearby Homes
- 35 Ellis Loop
- 0 Edith Nankipoo Rd Unit 10200861
- 2631 Highway 51 N
- 167 Caldwell Rd
- 2464 Edith Nankipoo Rd
- 2440 Edith Nankipoo Rd
- 158 Barry White Ln
- 357 Chisholm Lake Rd
- 480 Chisholm Lake Rd
- 102 Stone Brook Cove
- 107 Stone Brook Cove
- 103 Stone Brook Cove
- 738 American Way
- 0 Naber St
- 319 Jordan St
- 176 Roy Crain Rd
- 187 Collins St
- 1216 Cedar Grove Ext Rd
- 108 Walnut Ridge
- 0 Collins St
- 756 Central Curve Rd
- 851 Central Curve Rd
- 47 Ellis Loop
- 958 Central Curve Rd
- 73 Ellis Loop
- 763 Central Curve Rd
- 628 Central Curve Rd
- 917 Central Curve Rd
- 185 Labrador Ln
- 1032 Central Curve Rd
- 45 Labrador Ln Unit Labrador
- 25 Labrador Ln
- 496 Central Curve Rd
- 1111 Central Curve Rd
- 460 Central Curve Rd
- 435 Central Curve Rd
- 58 Clark Ln
- 38 Clark Ln
- 434 Central Curve Rd
- 1201 Central Curve Rd