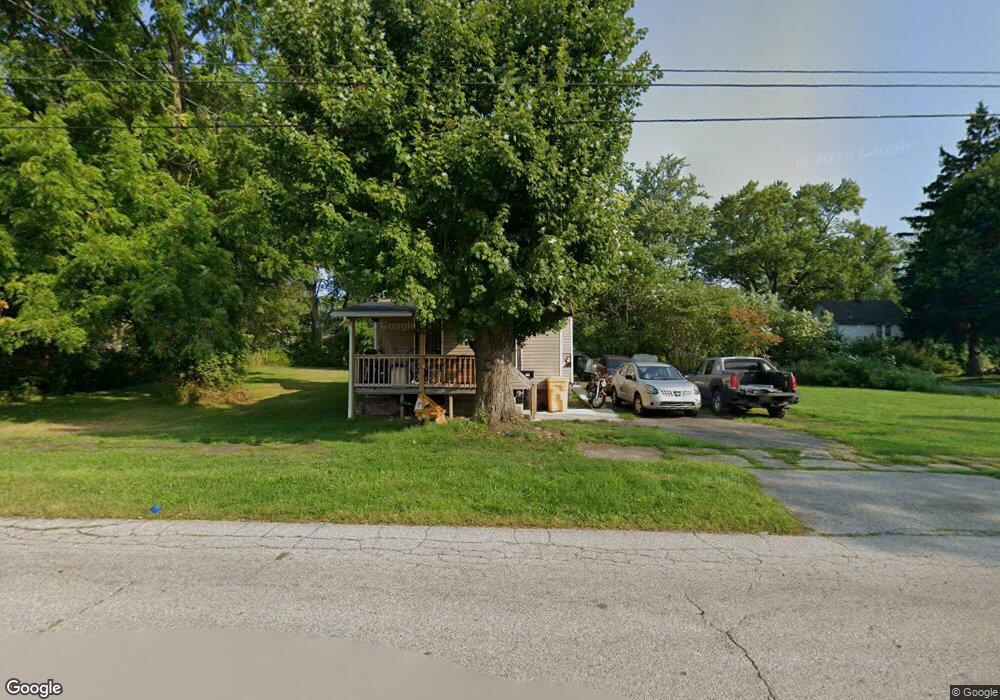
756 Clark St Conneaut, OH 44030
Estimated Value: $86,000 - $110,000
3
Beds
1
Bath
992
Sq Ft
$96/Sq Ft
Est. Value
About This Home
This home is located at 756 Clark St, Conneaut, OH 44030 and is currently estimated at $95,033, approximately $95 per square foot. 756 Clark St is a home located in Ashtabula County with nearby schools including Lakeshore Primary Elementary School, Gateway Elementary School, and Conneaut Middle School.
Ownership History
Date
Name
Owned For
Owner Type
Purchase Details
Closed on
Apr 7, 2017
Sold by
Hall Teresa and Headley Robert
Bought by
Petro Patricia L
Current Estimated Value
Purchase Details
Closed on
Jan 31, 2016
Sold by
Testa Kelly
Bought by
Hall Teresa and Headley Robert
Home Financials for this Owner
Home Financials are based on the most recent Mortgage that was taken out on this home.
Original Mortgage
$7,000
Interest Rate
3.97%
Mortgage Type
Unknown
Purchase Details
Closed on
Jun 18, 2015
Sold by
Pyle Michael J and Cragon Dawn M
Bought by
756 Clark Street Land Trust
Create a Home Valuation Report for This Property
The Home Valuation Report is an in-depth analysis detailing your home's value as well as a comparison with similar homes in the area
Home Values in the Area
Average Home Value in this Area
Purchase History
| Date | Buyer | Sale Price | Title Company |
|---|---|---|---|
| Petro Patricia L | $3,000 | None Available | |
| Hall Teresa | $7,000 | None Available | |
| 756 Clark Street Land Trust | $12,000 | Attorney |
Source: Public Records
Mortgage History
| Date | Status | Borrower | Loan Amount |
|---|---|---|---|
| Previous Owner | Hall Teresa | $7,000 |
Source: Public Records
Tax History Compared to Growth
Tax History
| Year | Tax Paid | Tax Assessment Tax Assessment Total Assessment is a certain percentage of the fair market value that is determined by local assessors to be the total taxable value of land and additions on the property. | Land | Improvement |
|---|---|---|---|---|
| 2024 | $868 | $11,870 | $4,550 | $7,320 |
| 2023 | $558 | $11,870 | $4,550 | $7,320 |
| 2022 | $478 | $8,930 | $3,500 | $5,430 |
| 2021 | $467 | $8,580 | $3,500 | $5,080 |
| 2020 | $467 | $8,580 | $3,500 | $5,080 |
| 2019 | $470 | $8,480 | $1,300 | $7,180 |
| 2018 | $196 | $3,610 | $1,300 | $2,310 |
| 2017 | $176 | $3,610 | $1,300 | $2,310 |
| 2016 | $200 | $4,100 | $1,160 | $2,940 |
| 2015 | $1,356 | $4,100 | $1,160 | $2,940 |
| 2014 | $3,819 | $4,100 | $1,160 | $2,940 |
| 2013 | $3,548 | $6,130 | $2,140 | $3,990 |
Source: Public Records
Map
Nearby Homes