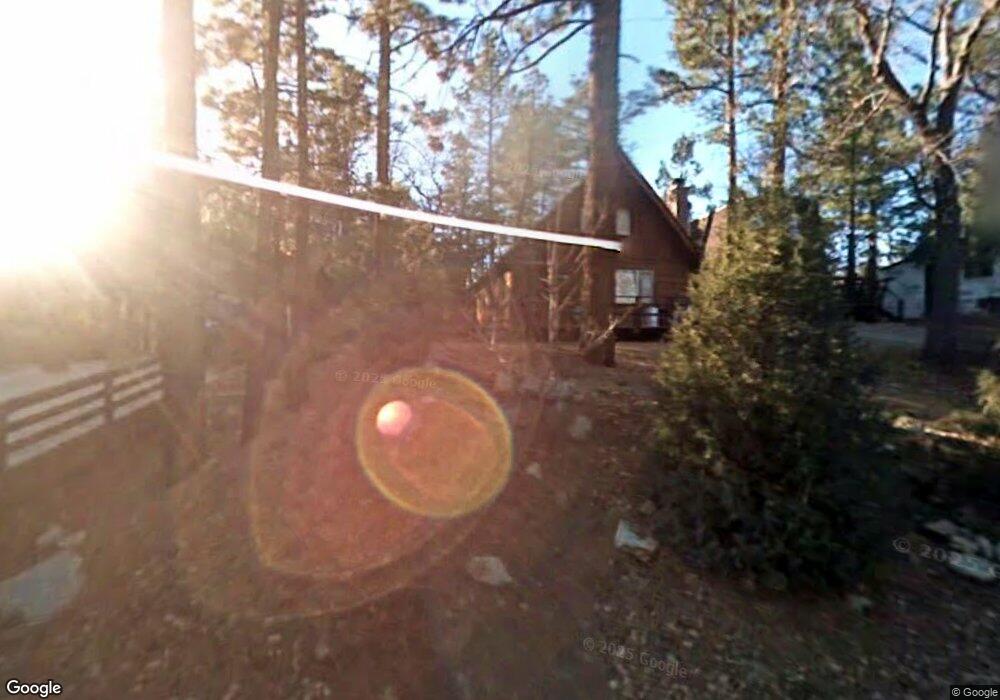
756 Moreno Ln Sugarloaf, CA 92386
Estimated Value: $285,000 - $388,000
3
Beds
12
Baths
952
Sq Ft
$341/Sq Ft
Est. Value
About This Home
This home is located at 756 Moreno Ln, Sugarloaf, CA 92386 and is currently estimated at $324,423, approximately $340 per square foot. 756 Moreno Ln is a home located in San Bernardino County with nearby schools including Baldwin Lane Elementary School, Big Bear Middle School, and Big Bear High School.
Ownership History
Date
Name
Owned For
Owner Type
Purchase Details
Closed on
Aug 26, 2020
Sold by
Garcia Joe and Garcia Annie
Bought by
Garcia Antonio
Current Estimated Value
Home Financials for this Owner
Home Financials are based on the most recent Mortgage that was taken out on this home.
Original Mortgage
$222,222
Outstanding Balance
$197,207
Interest Rate
2.9%
Mortgage Type
VA
Estimated Equity
$127,216
Create a Home Valuation Report for This Property
The Home Valuation Report is an in-depth analysis detailing your home's value as well as a comparison with similar homes in the area
Home Values in the Area
Average Home Value in this Area
Purchase History
| Date | Buyer | Sale Price | Title Company |
|---|---|---|---|
| Garcia Antonio | $214,500 | Orange Coast Ttl Co Of Socal |
Source: Public Records
Mortgage History
| Date | Status | Borrower | Loan Amount |
|---|---|---|---|
| Open | Garcia Antonio | $222,222 |
Source: Public Records
Tax History
| Year | Tax Paid | Tax Assessment Tax Assessment Total Assessment is a certain percentage of the fair market value that is determined by local assessors to be the total taxable value of land and additions on the property. | Land | Improvement |
|---|---|---|---|---|
| 2025 | $3,824 | $232,183 | $46,437 | $185,746 |
| 2024 | $3,657 | $227,630 | $45,526 | $182,104 |
| 2023 | $3,550 | $223,166 | $44,633 | $178,533 |
| 2022 | $3,421 | $218,790 | $43,758 | $175,032 |
| 2021 | $3,349 | $214,500 | $42,900 | $171,600 |
| 2020 | $1,934 | $81,940 | $27,317 | $54,623 |
| 2019 | $1,890 | $80,333 | $26,781 | $53,552 |
| 2018 | $1,815 | $78,758 | $26,256 | $52,502 |
| 2017 | $1,760 | $77,214 | $25,741 | $51,473 |
| 2016 | $1,713 | $75,700 | $25,236 | $50,464 |
| 2015 | $1,678 | $74,563 | $24,857 | $49,706 |
| 2014 | $1,644 | $73,102 | $24,370 | $48,732 |
Source: Public Records
Map
Nearby Homes
- 696 Highland Ln
- 682 Maple Ln
- 672 Holmes Ln
- 630 Victoria Ln
- 753 Maple Ln
- 742 Cedar Ln
- 811 Leonard Ln
- 817 Maple Ln
- 581 Highland Ln
- 846 Maple Ln
- 827 Wabash Ln
- 0 Vista Ln Unit IG26047338
- 0 Ave Unit 32502315
- 0 Vista Ln Unit 32600379
- 548 Moreno Ln
- 0 San Bernardino Ave Unit IG25277274
- 0 San Bernardino Ave Unit 32502826
- 303 Los Angeles
- 0 San Bernardino Ave Unit 32502825
- 0 San Bernardino Ave Unit IG25277280
Your Personal Tour Guide
Ask me questions while you tour the home.