J
Seller's Agent in 2024
Jennifer Schaffer
Sea Coast Rentals
(252) 945-5002
3 Total Sales
Estimated Value: $320,000 - $392,000
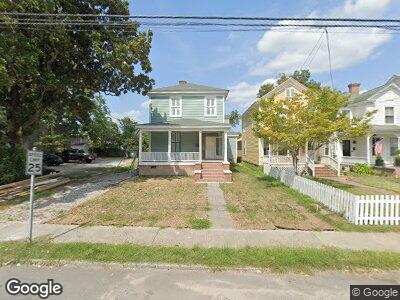
Beautiful 2,800 sq. ft. home in the Historic District of Washington with a completely renovated modern interior and traditional restored exterior. 4 bedrooms/ 3 baths. Stunning kitchen with a breakfast nook and loads of cabinets, drawers and open shelving. All new stainless-steel appliances. Separate living and dining area. Lovely details and upgrades. Deck, covered porch, fenced yard. Electric Heat/ AC and beautiful mantles. Wonderful walkable neighborhood with easy access to downtown and the Washington Waterfront.
| Date | Buyer | Sale Price | Title Company |
|---|---|---|---|
| Jen3 Properties Llc | $65,000 | -- |
| Date | Event | Price | Change | Sq Ft Price |
|---|---|---|---|---|
| 04/15/2024 04/15/24 | Rented | $2,400 | 0.0% | -- |
| 03/19/2024 03/19/24 | Under Contract | -- | -- | -- |
| 03/06/2024 03/06/24 | For Rent | $2,400 | 0.0% | -- |
| 02/19/2021 02/19/21 | Sold | $65,500 | -0.8% | $23 / Sq Ft |
| 02/01/2021 02/01/21 | Pending | -- | -- | -- |
| 01/28/2021 01/28/21 | Price Changed | $66,000 | -10.8% | $23 / Sq Ft |
| 01/14/2021 01/14/21 | Price Changed | $74,000 | -6.3% | $26 / Sq Ft |
| 12/29/2020 12/29/20 | Price Changed | $79,000 | -7.1% | $28 / Sq Ft |
| 12/16/2020 12/16/20 | Price Changed | $85,000 | -10.5% | $30 / Sq Ft |
| 12/01/2020 12/01/20 | For Sale | $95,000 | -- | $33 / Sq Ft |
| Year | Tax Paid | Tax Assessment Tax Assessment Total Assessment is a certain percentage of the fair market value that is determined by local assessors to be the total taxable value of land and additions on the property. | Land | Improvement |
|---|---|---|---|---|
| 2024 | $3,178 | $77,643 | $27,810 | $49,833 |
| 2023 | $936 | $77,643 | $27,810 | $49,833 |
| 2022 | $936 | $77,643 | $27,810 | $49,833 |
| 2021 | $1,067 | $77,643 | $27,810 | $49,833 |
| 2020 | $1,070 | $77,643 | $27,810 | $49,833 |
| 2019 | $1,060 | $77,643 | $27,810 | $49,833 |
| 2018 | $1,008 | $77,643 | $27,810 | $49,833 |
| 2017 | $1,008 | $80,653 | $28,620 | $52,033 |
| 2016 | $1,008 | $80,653 | $28,620 | $52,033 |
| 2015 | $921 | $0 | $0 | $0 |
| 2014 | $921 | $0 | $0 | $0 |
| 2013 | -- | $80,653 | $28,620 | $52,033 |
J
Seller's Agent in 2024
Jennifer Schaffer
Sea Coast Rentals
(252) 945-5002
3 Total Sales

Buyer's Agent in 2024
Elizabeth McAlduff
HARRIS REAL ESTATE GROUP, INC
(252) 341-6448
20 Total Sales
T
Seller's Agent in 2021
The Tingen Team
Berkshire Hathaway HomeServices Prime Properties
(252) 321-6161
418 Total Sales
Seller Co-Listing Agent in 2021
Jamie Tingen
Berkshire Hathaway HomeServices Prime Properties
(252) 347-4041
304 Total Sales
Buyer's Agent in 2021
Elliott Squires
Homeward Carolinas
(252) 702-8190
39 Total Sales