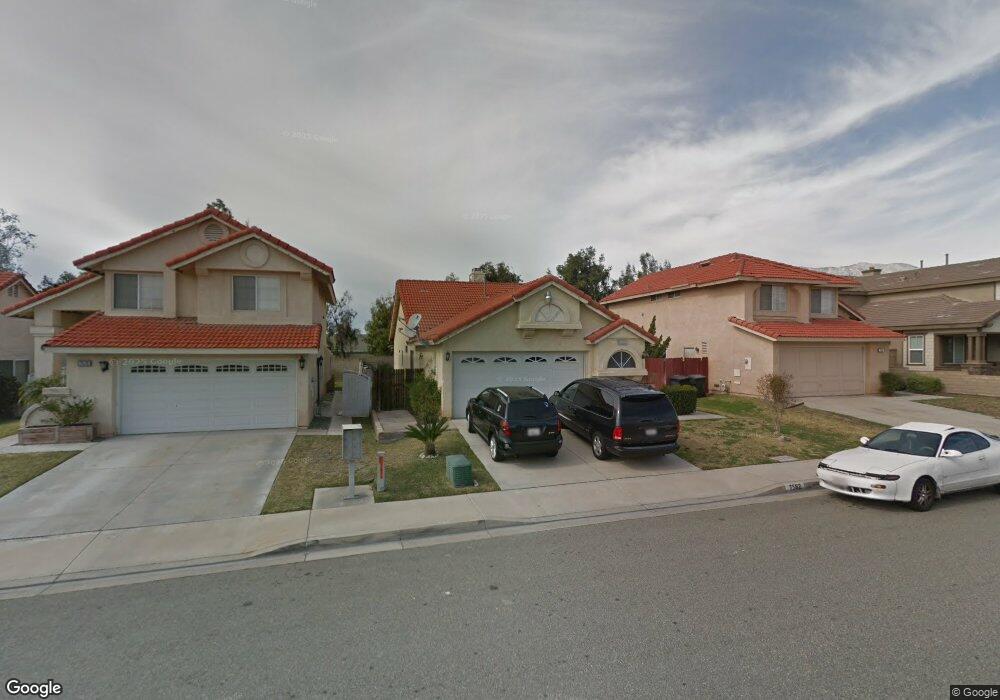
7562 Foxtail Ln Fontana, CA 92336
Rancho Fontana NeighborhoodEstimated Value: $582,000 - $614,000
3
Beds
2
Baths
1,210
Sq Ft
$492/Sq Ft
Est. Value
About This Home
This home is located at 7562 Foxtail Ln, Fontana, CA 92336 and is currently estimated at $595,904, approximately $492 per square foot. 7562 Foxtail Ln is a home located in San Bernardino County with nearby schools including Hemlock Elementary School, Almeria Middle School, and Summit High School.
Ownership History
Date
Name
Owned For
Owner Type
Purchase Details
Closed on
Jul 29, 2002
Sold by
Montayre Philippe R
Bought by
Delrosario Nora
Current Estimated Value
Home Financials for this Owner
Home Financials are based on the most recent Mortgage that was taken out on this home.
Original Mortgage
$148,000
Outstanding Balance
$62,850
Interest Rate
6.6%
Estimated Equity
$533,054
Purchase Details
Closed on
Oct 5, 2000
Sold by
Stanley Eric C
Bought by
Montayre Philippe R and Reinhard Emygrace G
Home Financials for this Owner
Home Financials are based on the most recent Mortgage that was taken out on this home.
Original Mortgage
$102,750
Interest Rate
8.95%
Purchase Details
Closed on
May 19, 1998
Sold by
Stanley Eric C
Bought by
Knudsen Stanley Eric C and Knudsen Stanley Donna
Home Financials for this Owner
Home Financials are based on the most recent Mortgage that was taken out on this home.
Original Mortgage
$112,200
Interest Rate
7.1%
Create a Home Valuation Report for This Property
The Home Valuation Report is an in-depth analysis detailing your home's value as well as a comparison with similar homes in the area
Home Values in the Area
Average Home Value in this Area
Purchase History
| Date | Buyer | Sale Price | Title Company |
|---|---|---|---|
| Delrosario Nora | $185,000 | Fidelity National Title Ins | |
| Montayre Philippe R | $137,000 | Southland Title | |
| Knudsen Stanley Eric C | -- | Commonwealth Land Title Co |
Source: Public Records
Mortgage History
| Date | Status | Borrower | Loan Amount |
|---|---|---|---|
| Open | Delrosario Nora | $148,000 | |
| Previous Owner | Montayre Philippe R | $102,750 | |
| Previous Owner | Knudsen Stanley Eric C | $112,200 | |
| Closed | Montayre Philippe R | $34,250 |
Source: Public Records
Tax History Compared to Growth
Tax History
| Year | Tax Paid | Tax Assessment Tax Assessment Total Assessment is a certain percentage of the fair market value that is determined by local assessors to be the total taxable value of land and additions on the property. | Land | Improvement |
|---|---|---|---|---|
| 2025 | $3,685 | $267,941 | $66,985 | $200,956 |
| 2024 | $3,685 | $262,688 | $65,672 | $197,016 |
| 2023 | $3,235 | $257,537 | $64,384 | $193,153 |
| 2022 | $3,204 | $252,488 | $63,122 | $189,366 |
| 2021 | $3,162 | $247,537 | $61,884 | $185,653 |
| 2020 | $3,141 | $244,998 | $61,249 | $183,749 |
| 2019 | $3,060 | $240,194 | $60,048 | $180,146 |
| 2018 | $3,079 | $235,485 | $58,871 | $176,614 |
| 2017 | $3,037 | $230,868 | $57,717 | $173,151 |
| 2016 | $2,968 | $226,341 | $56,585 | $169,756 |
| 2015 | $2,915 | $222,941 | $55,735 | $167,206 |
| 2014 | $2,902 | $218,574 | $54,643 | $163,931 |
Source: Public Records
Map
Nearby Homes
- 15454 Raymond Ave
- 7434 Freeport Cir
- 7550 Periwinkle Dr
- 7575 Lime Ave
- 15575 Allspice Ln
- 7239 Plumrose St
- 7868 Sea Salt Ave
- 15457 Red Pepper Place
- 7160 Birch Tree Place
- 14987 Pepperdine Dr
- 7140 Ironridge Ct
- 15581 Curry Place
- 7651 Yellow Iris Ct
- 15752 Mimosa Ct
- 7148 Camden Ct
- 7144 Riley Dr
- 7620 Catawba Ct
- 7541 Catawba Dr
- 15677 Barbee St
- 7600 Jacaranda Ave
- 7570 Foxtail Ln
- 7554 Foxtail Ln
- 7578 Foxtail Ln
- 7546 Foxtail Ln
- 15332 Lantern Ln
- 7586 Foxtail Ln
- 15340 Lantern Ln
- 7594 Foxtail Ln
- 15333 Palm Leaf Ln
- 15333 Lantern Ln
- 7526 Foxtail Ln
- 7541 Indigo Ct
- 7531 Indigo Ct
- 15348 Lantern Ln
- 7551 Indigo Ct
- 15341 Palm Leaf Ln
- 15341 Lantern Ln
- 7602 Foxtail Ln
- 7521 Indigo Ct
- 15349 Palm Leaf Ln