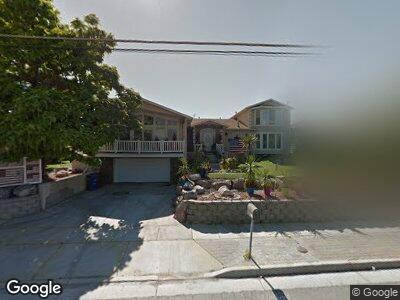
7564 S 1300 W West Jordan, UT 84084
Estimated Value: $863,000 - $1,226,000
4
Beds
3
Baths
5,969
Sq Ft
$173/Sq Ft
Est. Value
About This Home
This home is located at 7564 S 1300 W, West Jordan, UT 84084 and is currently estimated at $1,033,626, approximately $173 per square foot. 7564 S 1300 W is a home located in Salt Lake County with nearby schools including Heartland Elementary School, West Jordan Middle School, and West Jordan High School.
Ownership History
Date
Name
Owned For
Owner Type
Purchase Details
Closed on
Apr 4, 2007
Sold by
Alker John A and Walker Connie B
Bought by
Walker John Austin and Walker Connie Bernadine
Current Estimated Value
Purchase Details
Closed on
Feb 11, 2000
Sold by
Walker John A and Walker Connie B
Bought by
Walker John A and Walker Connie B
Home Financials for this Owner
Home Financials are based on the most recent Mortgage that was taken out on this home.
Original Mortgage
$252,000
Outstanding Balance
$97,018
Interest Rate
8.14%
Purchase Details
Closed on
Dec 12, 1995
Sold by
Walker John A and Walker Connie B
Bought by
Walker John A and Walker Connie B
Purchase Details
Closed on
Aug 21, 1995
Sold by
Crum Gene Robert and Crum Barbara D
Bought by
Highland 94 1 Ltd Partnership
Purchase Details
Closed on
Jan 11, 1995
Sold by
Crum Gene Robert and Crum Barbara D
Bought by
Highland 94-1 Partnership
Create a Home Valuation Report for This Property
The Home Valuation Report is an in-depth analysis detailing your home's value as well as a comparison with similar homes in the area
Home Values in the Area
Average Home Value in this Area
Purchase History
| Date | Buyer | Sale Price | Title Company |
|---|---|---|---|
| Walker John Austin | -- | None Available | |
| Walker John A | -- | Backman Stewart Title Servic | |
| Walker John A | -- | -- | |
| Highland 94 1 Ltd Partnership | -- | -- | |
| Highland 94 1 Ltd Partnership | -- | -- | |
| Highland 94-1 Partnership | -- | -- |
Source: Public Records
Mortgage History
| Date | Status | Borrower | Loan Amount |
|---|---|---|---|
| Closed | Jo Connie | $117,000 | |
| Open | Walker John A | $252,000 |
Source: Public Records
Tax History Compared to Growth
Tax History
| Year | Tax Paid | Tax Assessment Tax Assessment Total Assessment is a certain percentage of the fair market value that is determined by local assessors to be the total taxable value of land and additions on the property. | Land | Improvement |
|---|---|---|---|---|
| 2023 | $5,205 | $843,590 | $336,390 | $507,200 |
| 2022 | $5,350 | $855,990 | $329,890 | $526,100 |
| 2021 | $4,321 | $657,300 | $218,600 | $438,700 |
| 2020 | $4,088 | $578,600 | $218,600 | $360,000 |
| 2019 | $4,164 | $577,790 | $218,590 | $359,200 |
| 2018 | $3,885 | $533,590 | $212,390 | $321,200 |
| 2017 | $3,749 | $510,990 | $212,390 | $298,600 |
| 2016 | $3,441 | $434,790 | $212,390 | $222,400 |
| 2015 | $3,663 | $448,490 | $225,690 | $222,800 |
| 2014 | $3,500 | $421,390 | $215,090 | $206,300 |
Source: Public Records
Map
Nearby Homes
- 1401 Green Hedge Way
- 1432 Red Heather Ln
- 1390 W 7800 S Unit 1-5
- 7613 S Sunrise Place E
- 7487 S Moro Rock Ln
- 7693 S Redwood Rd
- 7724 S Rooftop Dr
- 1051 W Rooftop Dr Unit 401
- 1805 W 7600 S Unit D204
- 7735 S Barclay Dr
- 7411 S Drake Park Ct Unit 6
- 7094 S 1205 W
- 1689 Crystal Ridge Dr
- 1718 W Trey Way Unit 2
- 7407 S Pearson Park Ct Unit 14
- 7413 S Pearson Park Ct Unit 13
- 7279 S Kenadi Ct
- 7256 S Kenadi Ct Unit 10
- 8155 S Redwood Rd Unit 162A
- 8155 S Redwood Rd Unit 95
- 7564 S 1300 W
- 1311 Highland Hollow Dr
- 1311 W Highland Hollow Dr
- 1325 Highland Hollow Dr
- 1325 W Highland Hollow Dr
- 7594 S 1300 W
- 1337 W Highland Hollow Dr
- 1337 Highland Hollow Dr
- 1349 Highland Hollow Dr
- 1349 W Highland Hollow Dr
- 1312 Barton Hollow Dr
- 7523 Highland Hollow Cove
- 7523 S Highland Hollow Cove
- 1324 W Barton Hollow Dr
- 1324 Barton Hollow Dr
- 1336 Barton Hollow Dr
- 7522 Highland Hollow Cove
- 1361 Highland Hollow Dr
- 7513 S Highland Hollow Cove
- 7513 Highland Hollow Cove