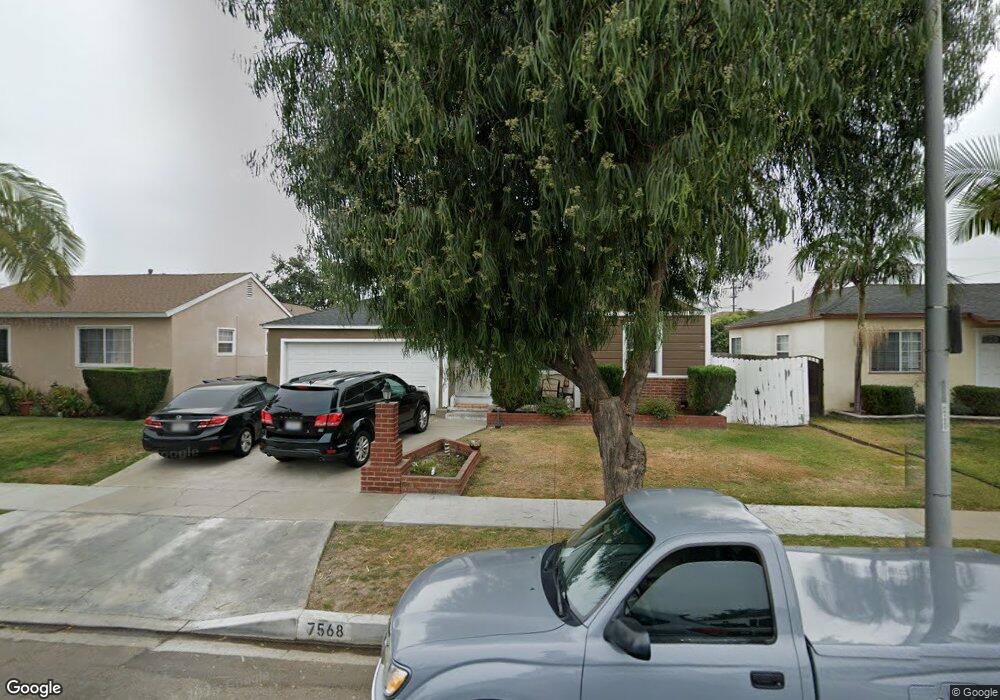
7568 Lemoran Ave Pico Rivera, CA 90660
Estimated Value: $556,000 - $695,000
2
Beds
1
Bath
882
Sq Ft
$740/Sq Ft
Est. Value
About This Home
This home is located at 7568 Lemoran Ave, Pico Rivera, CA 90660 and is currently estimated at $652,845, approximately $740 per square foot. 7568 Lemoran Ave is a home located in Los Angeles County with nearby schools including Rivera Elementary School, El Rancho High School, and Ruben Salazar Continuation School.
Ownership History
Date
Name
Owned For
Owner Type
Purchase Details
Closed on
Apr 19, 2004
Sold by
Rodriguez Samuel P
Bought by
Rodriguez Samuel P
Current Estimated Value
Home Financials for this Owner
Home Financials are based on the most recent Mortgage that was taken out on this home.
Original Mortgage
$162,000
Outstanding Balance
$75,606
Interest Rate
5.65%
Mortgage Type
New Conventional
Estimated Equity
$577,239
Purchase Details
Closed on
Oct 29, 2002
Sold by
Archuleta Christina
Bought by
Rodriguez Samuel P
Home Financials for this Owner
Home Financials are based on the most recent Mortgage that was taken out on this home.
Original Mortgage
$136,500
Interest Rate
5.88%
Mortgage Type
Stand Alone First
Purchase Details
Closed on
Oct 17, 2000
Sold by
Ruiz David and Ruiz Mayra
Bought by
Rodriguez Samuel P
Create a Home Valuation Report for This Property
The Home Valuation Report is an in-depth analysis detailing your home's value as well as a comparison with similar homes in the area
Home Values in the Area
Average Home Value in this Area
Purchase History
| Date | Buyer | Sale Price | Title Company |
|---|---|---|---|
| Rodriguez Samuel P | -- | First American Title Company | |
| Rodriguez Samuel P | -- | Provident Title | |
| Rodriguez Samuel P | -- | Provident Title | |
| Rodriguez Samuel P | -- | -- |
Source: Public Records
Mortgage History
| Date | Status | Borrower | Loan Amount |
|---|---|---|---|
| Open | Rodriguez Samuel P | $162,000 | |
| Closed | Rodriguez Samuel P | $136,500 |
Source: Public Records
Tax History
| Year | Tax Paid | Tax Assessment Tax Assessment Total Assessment is a certain percentage of the fair market value that is determined by local assessors to be the total taxable value of land and additions on the property. | Land | Improvement |
|---|---|---|---|---|
| 2025 | $3,789 | $240,537 | $201,289 | $39,248 |
| 2024 | $3,789 | $235,822 | $197,343 | $38,479 |
| 2023 | $3,686 | $231,199 | $193,474 | $37,725 |
| 2022 | $3,524 | $226,667 | $189,681 | $36,986 |
| 2021 | $3,420 | $222,223 | $185,962 | $36,261 |
| 2020 | $3,454 | $219,946 | $184,056 | $35,890 |
| 2019 | $3,393 | $215,635 | $180,448 | $35,187 |
| 2018 | $3,195 | $211,408 | $176,910 | $34,498 |
| 2016 | $2,896 | $203,201 | $170,042 | $33,159 |
| 2015 | $2,854 | $200,149 | $167,488 | $32,661 |
| 2014 | $2,823 | $196,230 | $164,208 | $32,022 |
Source: Public Records
Map
Nearby Homes
- 7705 Sage Dr
- 7679 Sunflower Dr
- 7686 Sunflower Dr
- 9522 Bascom St
- 9273 Sierra Vista Cir
- 9213 Call St
- 7422 Bequette Ave
- 9515 Shade Ln
- 9346 Canford St
- 8905 Warvale St
- 7128 Farmland Ave
- 8104 Arrington Ave
- 7021 Passons Blvd
- 7019 Passons Blvd
- 8328 Buhman Ave
- 8320 Orange Ave
- 8414 Cravell Ave
- 9734 Terradell St
- 8551 Eglise Ave
- 9950 La Docena Ln
- 7574 Lemoran Ave
- 7564 Lemoran Ave
- 7619 Passons Blvd
- 7625 Passons Blvd
- 7578 Lemoran Ave
- 7558 Lemoran Ave
- 7613 Passons Blvd
- 7631 Passons Blvd
- 7569 Lemoran Ave
- 7575 Lemoran Ave
- 7552 Lemoran Ave
- 7607 Passons Blvd
- 7563 Lemoran Ave
- 7584 Lemoran Ave
- 7635 Passons Blvd
- 7581 Lemoran Ave
- 7557 Lemoran Ave
- 7603 Passons Blvd
- 7548 Lemoran Ave
- 7641 Passons Blvd
Your Personal Tour Guide
Ask me questions while you tour the home.