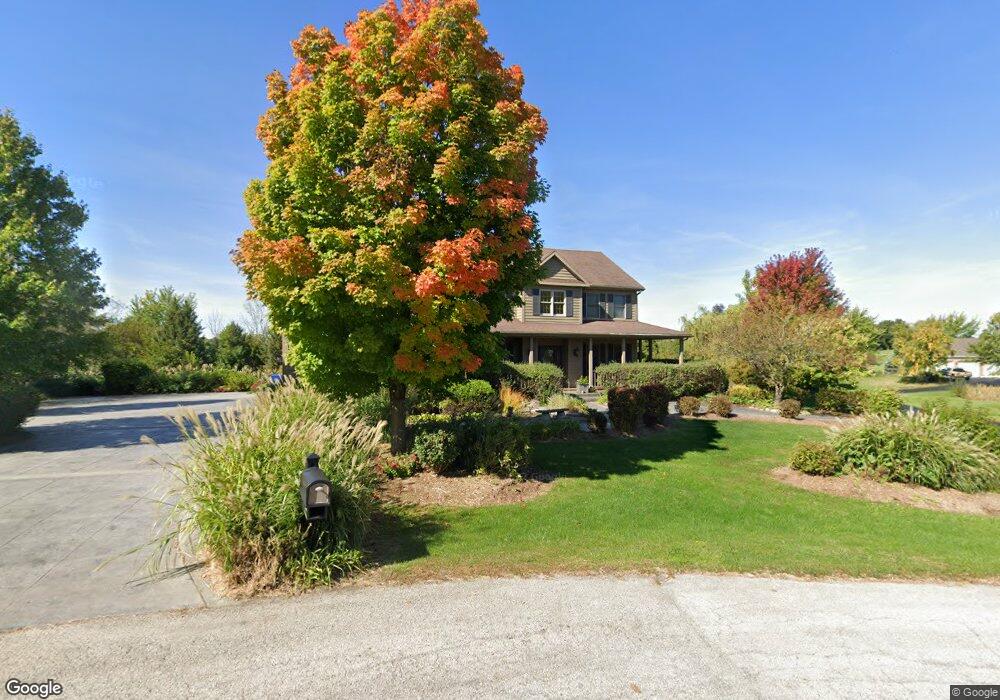
757 Carolyn Ct Elburn, IL 60119
Estimated Value: $697,000 - $751,000
5
Beds
4
Baths
3,444
Sq Ft
$209/Sq Ft
Est. Value
About This Home
This home is located at 757 Carolyn Ct, Elburn, IL 60119 and is currently estimated at $718,787, approximately $208 per square foot. 757 Carolyn Ct is a home located in Kane County with nearby schools including Kaneland Blackberry Creek Elementary School, Harter Middle School, and Kaneland Senior High School.
Ownership History
Date
Name
Owned For
Owner Type
Purchase Details
Closed on
Oct 8, 2008
Sold by
Zak Edward D and Zak Victoria E
Bought by
Zak Edward D
Current Estimated Value
Home Financials for this Owner
Home Financials are based on the most recent Mortgage that was taken out on this home.
Original Mortgage
$350,000
Outstanding Balance
$227,197
Interest Rate
5.94%
Mortgage Type
Stand Alone Refi Refinance Of Original Loan
Estimated Equity
$491,590
Purchase Details
Closed on
May 21, 2003
Sold by
Zak Edward D
Bought by
Zak Edward D and Zak Victoria E
Home Financials for this Owner
Home Financials are based on the most recent Mortgage that was taken out on this home.
Original Mortgage
$275,000
Interest Rate
5.4%
Mortgage Type
Unknown
Purchase Details
Closed on
Apr 14, 1998
Sold by
Amoni Larry M and Amoni Lynn A
Bought by
Zak Edward D
Create a Home Valuation Report for This Property
The Home Valuation Report is an in-depth analysis detailing your home's value as well as a comparison with similar homes in the area
Home Values in the Area
Average Home Value in this Area
Purchase History
| Date | Buyer | Sale Price | Title Company |
|---|---|---|---|
| Zak Edward D | -- | First American Title | |
| Zak Edward D | -- | Chicago Title Insurance Co | |
| Zak Edward D | $67,500 | -- |
Source: Public Records
Mortgage History
| Date | Status | Borrower | Loan Amount |
|---|---|---|---|
| Open | Zak Edward D | $350,000 | |
| Closed | Zak Edward D | $275,000 |
Source: Public Records
Tax History Compared to Growth
Tax History
| Year | Tax Paid | Tax Assessment Tax Assessment Total Assessment is a certain percentage of the fair market value that is determined by local assessors to be the total taxable value of land and additions on the property. | Land | Improvement |
|---|---|---|---|---|
| 2024 | $17,743 | $218,481 | $39,273 | $179,208 |
| 2023 | $15,695 | $180,984 | $35,445 | $145,539 |
| 2022 | $12,826 | $143,014 | $32,530 | $110,484 |
| 2021 | $12,419 | $136,882 | $31,135 | $105,747 |
| 2020 | $12,211 | $133,674 | $30,405 | $103,269 |
| 2019 | $12,222 | $131,712 | $29,959 | $101,753 |
| 2018 | $12,976 | $136,737 | $29,959 | $106,778 |
| 2017 | $12,982 | $135,182 | $29,618 | $105,564 |
| 2016 | $12,695 | $128,627 | $28,837 | $99,790 |
| 2015 | -- | $132,956 | $28,188 | $104,768 |
| 2014 | -- | $154,902 | $25,895 | $129,007 |
| 2013 | -- | $154,902 | $25,895 | $129,007 |
Source: Public Records
Map
Nearby Homes
- 764 Carolyn Ct
- 800 Carolyn Ct
- 816 Carolyn Ct
- 817 Carolyn Ct
- LOT 24 Carolyn Ct
- LOT 13 Carolyn Ct
- Lot 15 Carolyn Ct
- 900 Carolyn Ct
- 43W386 Kenmar Dr
- 43W330 Kenmar Dr
- 939 Carolyn Ct
- 43W360 Kenmar Dr
- 823 Independence Ave
- 835 Independence Ave Unit 2
- 925 Carolyn Ct
- 811 Independence Ave Unit 2
- 847 Independence Ave Unit 2
- 861 Independence Ave
- 43W420 Kenmar Dr
- 885 Independence Ave Unit 2