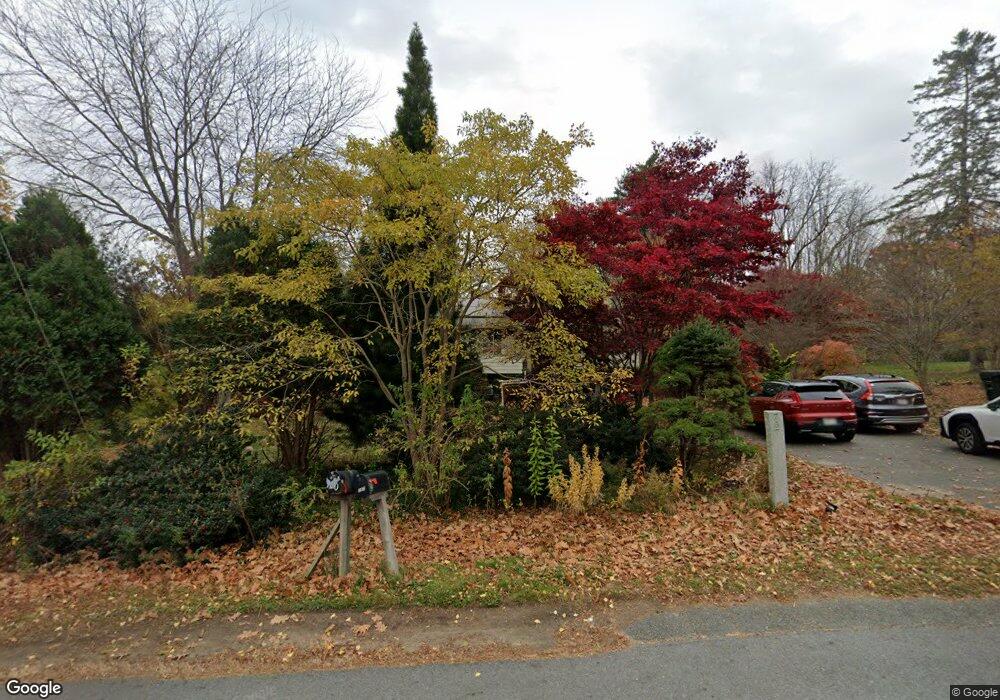
757 Main St West Newbury, MA 01985
Estimated Value: $678,184 - $865,000
3
Beds
2
Baths
1,479
Sq Ft
$517/Sq Ft
Est. Value
About This Home
This home is located at 757 Main St, West Newbury, MA 01985 and is currently estimated at $764,296, approximately $516 per square foot. 757 Main St is a home located in Essex County with nearby schools including Pentucket Regional High School and River Valley Charter School.
Ownership History
Date
Name
Owned For
Owner Type
Purchase Details
Closed on
Jul 11, 2014
Sold by
Richard Donald H and King Julie
Bought by
Richard Donald H and King Julie M
Current Estimated Value
Home Financials for this Owner
Home Financials are based on the most recent Mortgage that was taken out on this home.
Original Mortgage
$239,500
Outstanding Balance
$182,154
Interest Rate
4.12%
Mortgage Type
New Conventional
Estimated Equity
$582,142
Purchase Details
Closed on
Oct 25, 2011
Sold by
Schroeder Noel and Jones Michael I
Bought by
King Julie and Richard Donald H
Home Financials for this Owner
Home Financials are based on the most recent Mortgage that was taken out on this home.
Original Mortgage
$244,800
Interest Rate
4.15%
Mortgage Type
Purchase Money Mortgage
Purchase Details
Closed on
Jul 1, 2004
Sold by
Howell Paula H
Bought by
Jones Michael I and Schroeder Noel
Create a Home Valuation Report for This Property
The Home Valuation Report is an in-depth analysis detailing your home's value as well as a comparison with similar homes in the area
Home Values in the Area
Average Home Value in this Area
Purchase History
| Date | Buyer | Sale Price | Title Company |
|---|---|---|---|
| Richard Donald H | -- | -- | |
| King Julie | $288,000 | -- | |
| Jones Michael I | $385,380 | -- |
Source: Public Records
Mortgage History
| Date | Status | Borrower | Loan Amount |
|---|---|---|---|
| Open | Richard Donald H | $239,500 | |
| Previous Owner | Jones Michael I | $241,000 | |
| Previous Owner | Jones Michael I | $243,200 | |
| Previous Owner | King Julie | $244,800 |
Source: Public Records
Tax History Compared to Growth
Tax History
| Year | Tax Paid | Tax Assessment Tax Assessment Total Assessment is a certain percentage of the fair market value that is determined by local assessors to be the total taxable value of land and additions on the property. | Land | Improvement |
|---|---|---|---|---|
| 2025 | $6,414 | $593,900 | $303,900 | $290,000 |
| 2024 | $5,739 | $530,400 | $317,000 | $213,400 |
| 2023 | $5,857 | $531,000 | $293,600 | $237,400 |
| 2022 | $5,715 | $439,300 | $230,000 | $209,300 |
| 2021 | $5,956 | $400,300 | $210,800 | $189,500 |
| 2020 | $5,772 | $400,300 | $210,800 | $189,500 |
| 2019 | $5,470 | $375,400 | $182,100 | $193,300 |
| 2018 | $5,319 | $365,300 | $182,100 | $183,200 |
| 2017 | $5,315 | $365,300 | $182,100 | $183,200 |
| 2016 | $5,344 | $365,300 | $182,100 | $183,200 |
| 2015 | $4,324 | $275,600 | $141,800 | $133,800 |
Source: Public Records
Map
Nearby Homes
- 591 Main St
- 528 Main St Unit A
- 4 Stewart St Unit 4
- 231 Storey Ave
- 7 Peters Rd
- 16 Newhall Ln
- 20 Albion Ln
- 100 Turkey Hill Rd
- 167 Middle St
- 17 Lavalley Ln
- 151 River Rd
- 43 Prospect St
- 8 Glenn Rd
- 39 High St
- 28 Beacon St
- 70 Maple St
- 19 Cutter Ln Unit 19
- 15 Beacon St
- 13 Bailey Pond Ln Unit 13
- 11 Beacon St