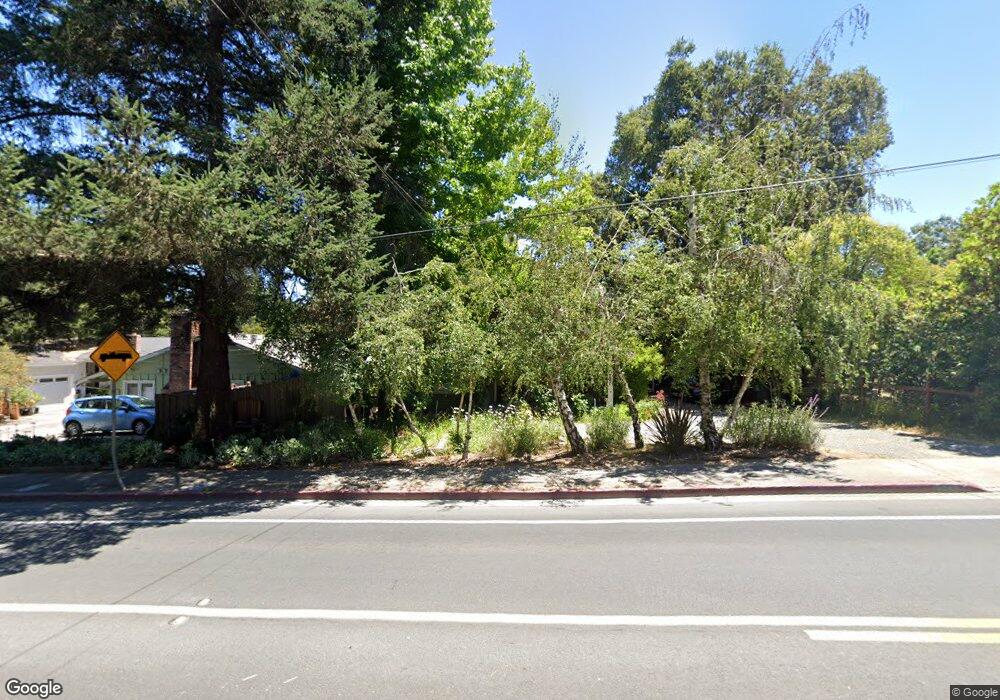
7571 Bodega Ave Sebastopol, CA 95472
Estimated Value: $658,945 - $888,000
2
Beds
1
Bath
1,522
Sq Ft
$511/Sq Ft
Est. Value
About This Home
This home is located at 7571 Bodega Ave, Sebastopol, CA 95472 and is currently estimated at $777,236, approximately $510 per square foot. 7571 Bodega Ave is a home located in Sonoma County with nearby schools including Park Side Elementary School, Brook Haven Elementary School, and Analy High School.
Ownership History
Date
Name
Owned For
Owner Type
Purchase Details
Closed on
Nov 19, 2010
Sold by
Johnson Ellen L
Bought by
Grossman Ian H and Johnson Ellen L
Current Estimated Value
Home Financials for this Owner
Home Financials are based on the most recent Mortgage that was taken out on this home.
Original Mortgage
$247,500
Outstanding Balance
$162,379
Interest Rate
4.16%
Mortgage Type
New Conventional
Estimated Equity
$614,857
Purchase Details
Closed on
Feb 5, 2002
Sold by
Pulsipher Michael W and Johnson Ellen L
Bought by
Johnson Ellen L
Home Financials for this Owner
Home Financials are based on the most recent Mortgage that was taken out on this home.
Original Mortgage
$120,550
Interest Rate
7.13%
Purchase Details
Closed on
Feb 9, 1999
Sold by
Johnson Pulsipher Ellen L and Johnson Ellen L
Bought by
Pulsipher Michael W and Johnson Pulsipher Ellen L
Home Financials for this Owner
Home Financials are based on the most recent Mortgage that was taken out on this home.
Original Mortgage
$130,000
Interest Rate
6.77%
Create a Home Valuation Report for This Property
The Home Valuation Report is an in-depth analysis detailing your home's value as well as a comparison with similar homes in the area
Home Values in the Area
Average Home Value in this Area
Purchase History
| Date | Buyer | Sale Price | Title Company |
|---|---|---|---|
| Grossman Ian H | -- | Cornerstone Title Company | |
| Johnson Ellen L | -- | Old Republic Title Company | |
| Pulsipher Michael W | -- | Old Republic Title Company |
Source: Public Records
Mortgage History
| Date | Status | Borrower | Loan Amount |
|---|---|---|---|
| Open | Grossman Ian H | $247,500 | |
| Previous Owner | Johnson Ellen L | $120,550 | |
| Previous Owner | Pulsipher Michael W | $130,000 |
Source: Public Records
Tax History
| Year | Tax Paid | Tax Assessment Tax Assessment Total Assessment is a certain percentage of the fair market value that is determined by local assessors to be the total taxable value of land and additions on the property. | Land | Improvement |
|---|---|---|---|---|
| 2025 | $1,590 | $116,484 | $27,934 | $88,550 |
| 2024 | $1,590 | $114,201 | $27,387 | $86,814 |
| 2023 | $1,590 | $111,962 | $26,850 | $85,112 |
| 2022 | $1,552 | $109,768 | $26,324 | $83,444 |
| 2021 | $1,551 | $107,616 | $25,808 | $81,808 |
| 2020 | $1,598 | $106,514 | $25,544 | $80,970 |
| 2019 | $1,513 | $104,427 | $25,044 | $79,383 |
| 2018 | $1,498 | $102,380 | $24,553 | $77,827 |
| 2017 | $1,438 | $100,373 | $24,072 | $76,301 |
| 2016 | $1,396 | $98,405 | $23,600 | $74,805 |
| 2015 | $1,360 | $96,928 | $23,246 | $73,682 |
| 2014 | $1,343 | $95,030 | $22,791 | $72,239 |
Source: Public Records
Map
Nearby Homes
- 7600 Washington Ave
- 7671 Leland St
- 7613 Washington Ave
- 375 Florence Ave
- 5200 California 116
- 486 S Main St
- 200 Pleasant Hill Ave N
- 5301 Gravenstein Hwy S
- 7950 Viola Ct
- 8086 Bodega Ave
- 789 Pleasant Hill Rd
- 8148 Bodega Ave
- 539 Norlee St
- 8256 Valley View Dr
- 8091 Hill Dr
- 6820 Redwood Ave Unit 63
- 6781 Evergreen Ave
- 0 Bodega Hwy
- 1171 Gravenstein Hwy S
- 1430 Santa Maria Way
- 7559 Bodega Ave
- 7591 Bodega Ave
- 7549 Bodega Ave
- 7565 Bodega Ave
- 7600 Bodega Ave
- 7560 Bodega Ave
- 7539 Bodega Ave
- 7596 Bodega Ave
- 380 Jewell Ave
- 7556 Bodega Ave
- 7605 Bodega Ave
- 440 Jewell Ave
- 7533 Bodega Ave
- 7610 Bodega Ave
- 7529 Bodega Ave
- 7526 Bodega Ave
- 7624 Bodega Ave
- 7628 Bodega Ave
- 7611 Bodega Ave
- 7502 Bodega Ave Unit 7508 Washington Ave.
Your Personal Tour Guide
Ask me questions while you tour the home.