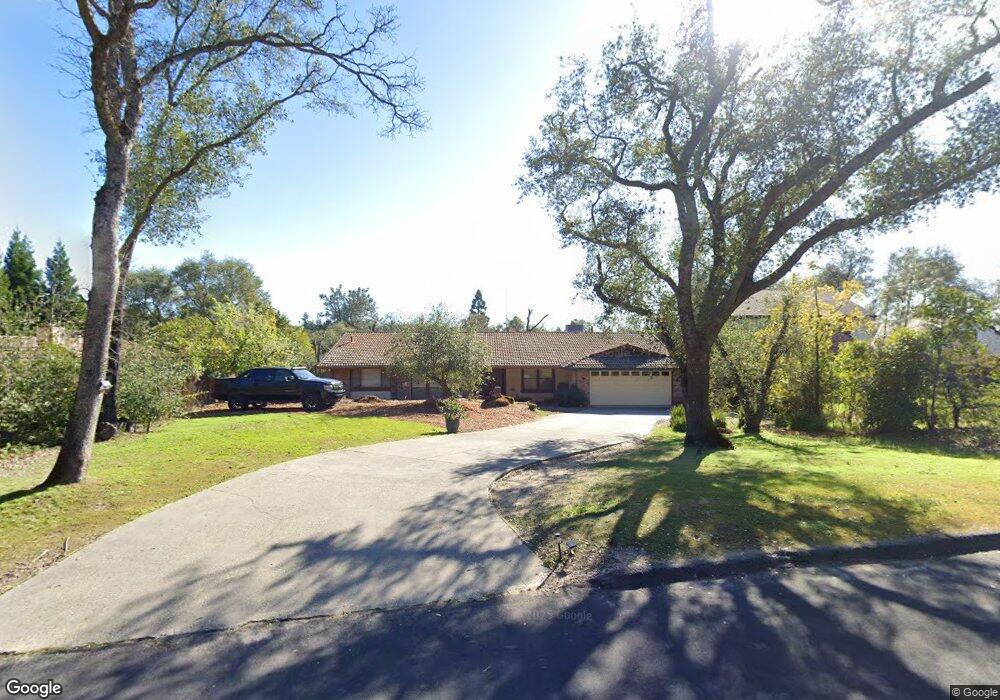
7574 Mia Linda Ct Granite Bay, CA 95746
Estimated Value: $775,000 - $935,000
4
Beds
3
Baths
2,364
Sq Ft
$355/Sq Ft
Est. Value
About This Home
This home is located at 7574 Mia Linda Ct, Granite Bay, CA 95746 and is currently estimated at $839,157, approximately $354 per square foot. 7574 Mia Linda Ct is a home located in Placer County with nearby schools including Greenhills Elementary School, Ridgeview Elementary School, and Willma Cavitt Junior High School.
Ownership History
Date
Name
Owned For
Owner Type
Purchase Details
Closed on
Feb 12, 2020
Sold by
Tyson Steven M
Bought by
Tyson Steven M
Current Estimated Value
Home Financials for this Owner
Home Financials are based on the most recent Mortgage that was taken out on this home.
Original Mortgage
$212,000
Outstanding Balance
$188,137
Interest Rate
3.72%
Mortgage Type
New Conventional
Estimated Equity
$651,020
Purchase Details
Closed on
Sep 9, 2008
Sold by
Tyson Steven M
Bought by
Tyson Steven M
Purchase Details
Closed on
Oct 12, 2007
Sold by
Watkins Mike and Watkins Gerald
Bought by
Tyson Steven M
Home Financials for this Owner
Home Financials are based on the most recent Mortgage that was taken out on this home.
Original Mortgage
$243,200
Interest Rate
6.4%
Mortgage Type
Negative Amortization
Create a Home Valuation Report for This Property
The Home Valuation Report is an in-depth analysis detailing your home's value as well as a comparison with similar homes in the area
Home Values in the Area
Average Home Value in this Area
Purchase History
| Date | Buyer | Sale Price | Title Company |
|---|---|---|---|
| Tyson Steven M | -- | Placer Title Company | |
| Tyson Steven M | -- | Placer Title Company | |
| Tyson Steven M | -- | None Available | |
| Tyson Steven M | $304,000 | Placer Title Company |
Source: Public Records
Mortgage History
| Date | Status | Borrower | Loan Amount |
|---|---|---|---|
| Open | Tyson Steven M | $212,000 | |
| Closed | Tyson Steven M | $243,200 |
Source: Public Records
Tax History Compared to Growth
Tax History
| Year | Tax Paid | Tax Assessment Tax Assessment Total Assessment is a certain percentage of the fair market value that is determined by local assessors to be the total taxable value of land and additions on the property. | Land | Improvement |
|---|---|---|---|---|
| 2025 | $4,864 | $399,295 | $197,022 | $202,273 |
| 2023 | $4,864 | $383,791 | $189,372 | $194,419 |
| 2022 | $4,792 | $376,266 | $185,659 | $190,607 |
| 2021 | $4,711 | $368,889 | $182,019 | $186,870 |
| 2020 | $4,701 | $365,107 | $180,153 | $184,954 |
| 2019 | $4,667 | $357,949 | $176,621 | $181,328 |
| 2018 | $4,498 | $350,931 | $173,158 | $177,773 |
| 2017 | $4,521 | $344,051 | $169,763 | $174,288 |
| 2016 | $4,431 | $337,306 | $166,435 | $170,871 |
| 2015 | $4,352 | $332,240 | $163,935 | $168,305 |
| 2014 | $4,295 | $325,733 | $160,724 | $165,009 |
Source: Public Records
Map
Nearby Homes
- 8420 Lakeland Dr
- 8432 W Granite Dr
- 7537 Dove Ct
- 8395 W Hidden Lakes Dr
- 8293 Robert Ct
- 8465 Serene View Rd
- 8177 E Granite Dr
- SOL3 Plan at Premier Soleil
- SOL1+ Plan at Premier Soleil
- SOL4 Plan at Premier Soleil
- SOL2 Plan at Premier Soleil
- SOL1 Plan at Premier Soleil
- 7080 Soleil Way
- 8670 Lake Front Dr
- 8444 Sun View Cir
- 8460 Sun View Cir
- 7070 Soleil Way
- 7090 Soleil Way
- 8461 Sun View Cir
- 7172 Cedar Oaks Dr
- 7564 Mia Linda Ct
- 8540 Lakeland Dr
- 7554 Mia Linda Ct
- 7591 Mia Linda Ct
- 7567 Mia Linda Ct
- 7654 Conquistador Ct
- 7544 Mia Linda Ct
- 7605 Red Bud Rd
- 7559 Mia Linda Ct
- 7595 Red Bud Rd
- 7651 Conquistador Ct
- 7551 Mia Linda Ct
- 7674 Conquistador Ct
- 7575 Red Bud Rd
- 7534 Mia Linda Ct
- 7635 Red Bud Rd
- 8450 Lakeland Dr
- 7545 Mia Linda Ct
- 8482 W Granite Dr
- 8555 Mooney Rd