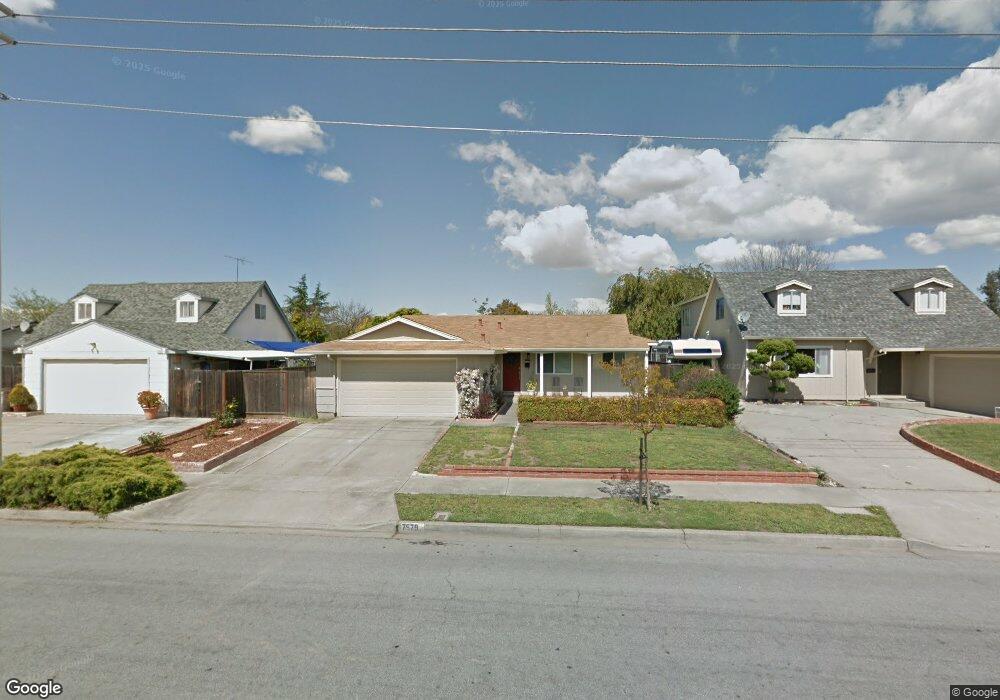
7579 Mayhews Landing Rd Newark, CA 94560
Estimated Value: $960,000 - $1,186,145
3
Beds
2
Baths
1,232
Sq Ft
$890/Sq Ft
Est. Value
About This Home
This home is located at 7579 Mayhews Landing Rd, Newark, CA 94560 and is currently estimated at $1,096,286, approximately $889 per square foot. 7579 Mayhews Landing Rd is a home located in Alameda County with nearby schools including Lincoln Elementary School, Newark Junior High School, and Newark Memorial High School.
Ownership History
Date
Name
Owned For
Owner Type
Purchase Details
Closed on
Jul 19, 2020
Sold by
Zhang Lian
Bought by
Zhang Lian and The Lian Zhang Revocable Trust
Current Estimated Value
Purchase Details
Closed on
Dec 26, 2018
Sold by
Humphreys Gary L and Humphreys Linda
Bought by
Zhang Lian
Home Financials for this Owner
Home Financials are based on the most recent Mortgage that was taken out on this home.
Original Mortgage
$430,000
Outstanding Balance
$379,577
Interest Rate
4.8%
Mortgage Type
New Conventional
Estimated Equity
$716,709
Purchase Details
Closed on
Apr 14, 1995
Sold by
Bailey Ronald E and Bailey Donna L
Bought by
Humphreys Gary L and Humphreys Linda
Home Financials for this Owner
Home Financials are based on the most recent Mortgage that was taken out on this home.
Original Mortgage
$170,000
Interest Rate
8.44%
Mortgage Type
Seller Take Back
Create a Home Valuation Report for This Property
The Home Valuation Report is an in-depth analysis detailing your home's value as well as a comparison with similar homes in the area
Home Values in the Area
Average Home Value in this Area
Purchase History
| Date | Buyer | Sale Price | Title Company |
|---|---|---|---|
| Zhang Lian | -- | None Available | |
| Zhang Lian | $762,000 | Cornerstone Title Company | |
| Humphreys Gary L | $179,000 | Northwestern Title Company |
Source: Public Records
Mortgage History
| Date | Status | Borrower | Loan Amount |
|---|---|---|---|
| Open | Zhang Lian | $430,000 | |
| Previous Owner | Humphreys Gary L | $170,000 |
Source: Public Records
Tax History
| Year | Tax Paid | Tax Assessment Tax Assessment Total Assessment is a certain percentage of the fair market value that is determined by local assessors to be the total taxable value of land and additions on the property. | Land | Improvement |
|---|---|---|---|---|
| 2025 | $10,367 | $849,787 | $368,115 | $481,672 |
| 2024 | $10,367 | $833,126 | $360,897 | $472,229 |
| 2023 | $10,093 | $816,793 | $353,822 | $462,971 |
| 2022 | $9,973 | $800,781 | $346,886 | $453,895 |
| 2021 | $9,723 | $785,079 | $340,084 | $444,995 |
| 2020 | $9,616 | $777,036 | $336,600 | $440,436 |
| 2019 | $1,298 | $63,299 | $19,781 | $43,518 |
| 2018 | $1,272 | $62,058 | $19,393 | $42,665 |
| 2017 | $1,240 | $60,842 | $19,013 | $41,829 |
| 2016 | $1,209 | $59,648 | $18,640 | $41,008 |
| 2015 | $1,203 | $58,752 | $18,360 | $40,392 |
| 2014 | $1,164 | $57,601 | $18,000 | $39,601 |
Source: Public Records
Map
Nearby Homes
- 36563 Beutke Dr
- 36871 Locust St
- 8093 Del Monte Ave
- 36184 Toulouse St
- 6417/6433 Thornton Ave
- 7843 Railroad Ave
- 6328 Zulmida Ave
- 6364 Noel Ave
- 37029 Olive St
- 6252 Bennington Dr
- 6449 Cedar Blvd
- 35760 Haley St
- 6245 Thornton Ave
- 6048 Bellhaven Ave
- 36075 Crystal Springs Dr
- 36063 Crystal Springs Dr
- 37645 Bay Crest Rd
- 37471 Bay Crest Rd
- 37541 Bay Crest Rd
- 36465 Hafner St
- 7621 Mayhews Landing Rd
- 7555 Mayhews Landing Rd
- 7570 Buckeye Place
- 7548 Buckeye Place
- 7657 Mayhews Landing Rd
- 36545 Buckeye St
- 36523 Buckeye St
- 7592 Buckeye Place
- 7558 Mayhews Landing Rd
- 7594 Mayhews Landing Rd
- 36570 Bettencourt St
- 36584 Bettencourt St
- 7526 Mayhews Landing Rd
- 7630 Mayhews Landing Rd
- 7492 Mayhews Landing Rd
- 36556 Bettencourt St
- 7662 Mayhews Landing Rd
- 7591 Buckeye Place
- 7460 Mayhews Landing Rd
- 36495 Buckeye St
Your Personal Tour Guide
Ask me questions while you tour the home.