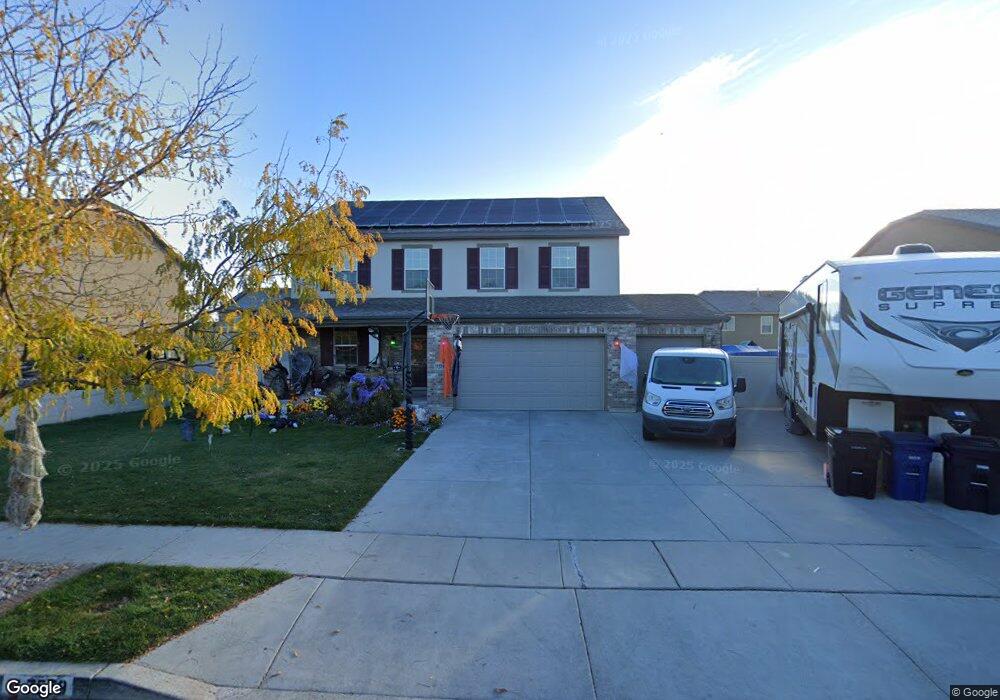
7579 S 4770 W Unit 345 West Jordan, UT 84084
Shadow Mountain NeighborhoodEstimated Value: $664,000 - $793,000
4
Beds
3
Baths
3,535
Sq Ft
$203/Sq Ft
Est. Value
About This Home
This home is located at 7579 S 4770 W Unit 345, West Jordan, UT 84084 and is currently estimated at $717,365, approximately $202 per square foot. 7579 S 4770 W Unit 345 is a home located in Salt Lake County with nearby schools including Hayden Peak Elementary School, West Hills Middle School, and Copper Hills High School.
Ownership History
Date
Name
Owned For
Owner Type
Purchase Details
Closed on
Sep 18, 2020
Sold by
Rich Shurree Eileen and Rich Gregory F
Bought by
Rich Shurree Eileen
Current Estimated Value
Home Financials for this Owner
Home Financials are based on the most recent Mortgage that was taken out on this home.
Original Mortgage
$302,800
Outstanding Balance
$268,715
Interest Rate
2.9%
Mortgage Type
New Conventional
Estimated Equity
$448,650
Purchase Details
Closed on
Dec 13, 2012
Sold by
Ricmond American Homes Of Utah Inc
Bought by
Rich Shureee Eileen and Rich Gregory F
Home Financials for this Owner
Home Financials are based on the most recent Mortgage that was taken out on this home.
Original Mortgage
$290,534
Interest Rate
3.25%
Mortgage Type
FHA
Purchase Details
Closed on
Feb 3, 2010
Sold by
Drh Energy Inc
Bought by
Colco Development Inc
Purchase Details
Closed on
Jan 18, 2010
Sold by
D R Horton Inc
Bought by
Colco Development Inc
Create a Home Valuation Report for This Property
The Home Valuation Report is an in-depth analysis detailing your home's value as well as a comparison with similar homes in the area
Home Values in the Area
Average Home Value in this Area
Purchase History
| Date | Buyer | Sale Price | Title Company |
|---|---|---|---|
| Rich Shurree Eileen | -- | Eagle Pointe Title | |
| Rich Shureee Eileen | -- | First American Title Co Llc | |
| Colco Development Inc | -- | Accommodation | |
| Colco Development Inc | -- | Provo Land Title Company |
Source: Public Records
Mortgage History
| Date | Status | Borrower | Loan Amount |
|---|---|---|---|
| Open | Rich Shurree Eileen | $302,800 | |
| Closed | Rich Shureee Eileen | $290,534 |
Source: Public Records
Tax History Compared to Growth
Tax History
| Year | Tax Paid | Tax Assessment Tax Assessment Total Assessment is a certain percentage of the fair market value that is determined by local assessors to be the total taxable value of land and additions on the property. | Land | Improvement |
|---|---|---|---|---|
| 2025 | $3,582 | $716,600 | $165,600 | $551,000 |
| 2024 | $3,582 | $689,100 | $158,600 | $530,500 |
| 2023 | $3,600 | $652,700 | $149,600 | $503,100 |
| 2022 | $3,616 | $645,100 | $146,700 | $498,400 |
| 2021 | $3,076 | $499,600 | $112,500 | $387,100 |
| 2020 | $2,947 | $449,200 | $112,500 | $336,700 |
| 2019 | $2,934 | $438,500 | $88,000 | $350,500 |
| 2018 | $2,798 | $414,800 | $85,000 | $329,800 |
| 2017 | $2,613 | $385,600 | $85,000 | $300,600 |
| 2016 | $2,587 | $358,700 | $85,000 | $273,700 |
| 2015 | $2,501 | $338,100 | $84,200 | $253,900 |
| 2014 | $2,457 | $327,000 | $82,600 | $244,400 |
Source: Public Records
Map
Nearby Homes
- 7502 S Lace Wood Dr Unit 417
- 7493 S Lace Wood Dr
- 7518 Park Village Dr
- 6880 S Survey Peak Ln
- 6884 S Survey Peak Ln
- 6888 S Survey Peak Ln
- 7173 S Kristilyn Ln
- 4678 Emmons Dr
- 7556 S Opal Mountain Way W Unit 311
- 7569 S Opal Mountain Way W Unit 308
- 7554 S Opal Mountain Way W Unit 310
- 7553 S Opal Mountain Way W Unit 302
- 7973 S Nebo Dr
- 7138 S Brittany Town Dr
- 7414 Regal Hill Dr
- 7093 S Greensand Dr
- 7071 S Kristilyn Ln
- 7288 Comet Hill Cir
- 7908 Cold Stone Ln Unit N3
- 7882 S Dove Creek Ln Unit A6
- 7567 S 4770 W
- 7567 S 4770 W Unit 344
- 7591 S 4770 W
- 7591 S 4770 W Unit 346
- 7582 S 4730 W Unit 336
- 7568 S 4730 W Unit 337
- 7568 S 4730 W
- 7594 S 4730 W Unit 335
- 7553 S 4770 W Unit 343
- 7553 S 4770 W
- 7586 S 4770 W Unit 352
- 7586 S 4770 W
- 7574 S 4770 W
- 7574 S 4770 W Unit 353
- 7598 S 4770 W
- 7598 S 4770 W Unit 351
- 7606 S 4730 W Unit 334
- 7556 S 4730 W
- 7556 S 4730 W Unit 338
- 7603 S 4770 W