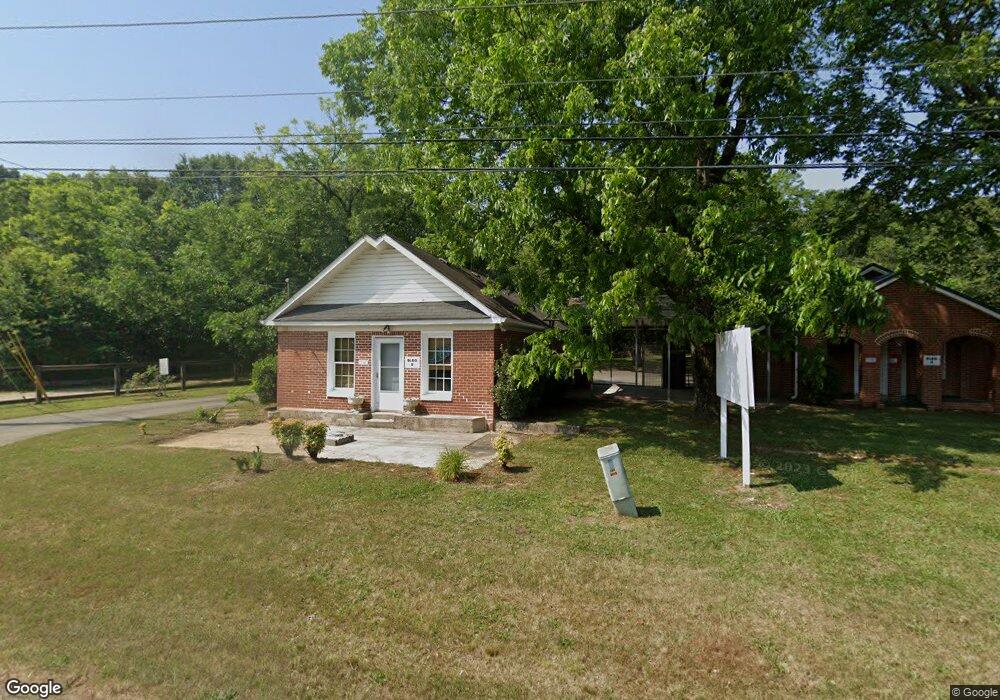
758 Atlanta Hwy NW Winder, GA 30680
Estimated Value: $179,968
--
Bed
--
Bath
861
Sq Ft
$209/Sq Ft
Est. Value
About This Home
This home is located at 758 Atlanta Hwy NW, Winder, GA 30680 and is currently estimated at $179,968, approximately $209 per square foot. 758 Atlanta Hwy NW is a home located in Barrow County with nearby schools including Kennedy Elementary School, Westside Middle School, and Apalachee High School.
Ownership History
Date
Name
Owned For
Owner Type
Purchase Details
Closed on
Sep 25, 2018
Sold by
Cheek John E
Bought by
Gentry Mary C
Current Estimated Value
Home Financials for this Owner
Home Financials are based on the most recent Mortgage that was taken out on this home.
Original Mortgage
$90,185
Outstanding Balance
$53,245
Interest Rate
4.5%
Mortgage Type
New Conventional
Estimated Equity
$126,723
Purchase Details
Closed on
Jul 31, 2018
Sold by
Scott Mack A
Bought by
Cheek John E
Home Financials for this Owner
Home Financials are based on the most recent Mortgage that was taken out on this home.
Original Mortgage
$90,185
Outstanding Balance
$53,245
Interest Rate
4.5%
Mortgage Type
New Conventional
Estimated Equity
$126,723
Purchase Details
Closed on
Feb 10, 2016
Sold by
Scott Mack A
Bought by
Scott Mack A and Garton Emma Marie
Purchase Details
Closed on
Dec 2, 1997
Sold by
White Roy L and White Robin R
Bought by
Scott Mack A and Scott Betty S
Purchase Details
Closed on
Oct 2, 1992
Bought by
White Roy Lee and White Ro
Create a Home Valuation Report for This Property
The Home Valuation Report is an in-depth analysis detailing your home's value as well as a comparison with similar homes in the area
Home Values in the Area
Average Home Value in this Area
Purchase History
| Date | Buyer | Sale Price | Title Company |
|---|---|---|---|
| Gentry Mary C | $93,685 | -- | |
| Cheek John E | $62,500 | -- | |
| Scott Mack A | -- | -- | |
| Scott Mack A | $37,000 | -- | |
| White Roy Lee | -- | -- |
Source: Public Records
Mortgage History
| Date | Status | Borrower | Loan Amount |
|---|---|---|---|
| Open | Gentry Mary C | $90,185 |
Source: Public Records
Tax History Compared to Growth
Tax History
| Year | Tax Paid | Tax Assessment Tax Assessment Total Assessment is a certain percentage of the fair market value that is determined by local assessors to be the total taxable value of land and additions on the property. | Land | Improvement |
|---|---|---|---|---|
| 2024 | $1,169 | $46,230 | $9,800 | $36,430 |
| 2023 | $1,180 | $46,230 | $9,800 | $36,430 |
| 2022 | $1,365 | $46,359 | $9,800 | $36,559 |
| 2021 | $1,412 | $45,726 | $14,000 | $31,726 |
| 2020 | $1,416 | $45,726 | $14,000 | $31,726 |
| 2019 | $1,190 | $45,726 | $14,000 | $31,726 |
| 2018 | $1,285 | $41,353 | $10,000 | $31,353 |
| 2017 | $1,155 | $39,674 | $10,000 | $29,674 |
| 2016 | $1,082 | $35,057 | $10,000 | $25,057 |
| 2015 | $1,088 | $35,057 | $10,000 | $25,057 |
| 2014 | $951 | $29,537 | $4,480 | $25,057 |
| 2013 | -- | $27,971 | $3,920 | $24,051 |
Source: Public Records
Map
Nearby Homes
- 109 Plantation Rd
- 31 Creekwood Rd
- 152 Scott Dr
- 407 Gladiola Dr
- 353 Glenmoor Place
- 1237 Carl Bethlehem Rd
- 534 Oxford Ridge
- 319 Chimney Trace Dr
- 552 Casey's Crossing
- 711 Brighton Ln
- 482 Cedar Trail
- 440 Briarwood Rd
- 1120 Carl Bethlehem Rd
- 454 Cedar Ridge Dr
- 141 Wingate Dr Unit 24A
- 141 Wingate Dr
- Noble Plan at Summerlin
- Winston Plan at Summerlin
- Rosewood Plan at Summerlin
- 2 Deer Run Trail
- 752 Atlanta Hwy NW
- 768 Atlanta Hwy NW
- 873 Bankhead Hwy
- 4 Deer Run Trail
- 859 Bankhead Hwy
- 6 Deer Run Trail
- 19 Pressley Rd
- 733 Atlanta Hwy NW
- 582 Matthews School Rd
- 20 Pressley Rd
- 843 Bankhead Hwy
- 8 Deer Run Trail
- 0 Pressley Rd Unit 8278287
- 0 Pressley Rd
- 14 Creekwood Rd
- 831 Bankhead Hwy
- 10 Deer Run Trail
- 817 Bankhead Hwy
- 682 Atlanta Hwy NW