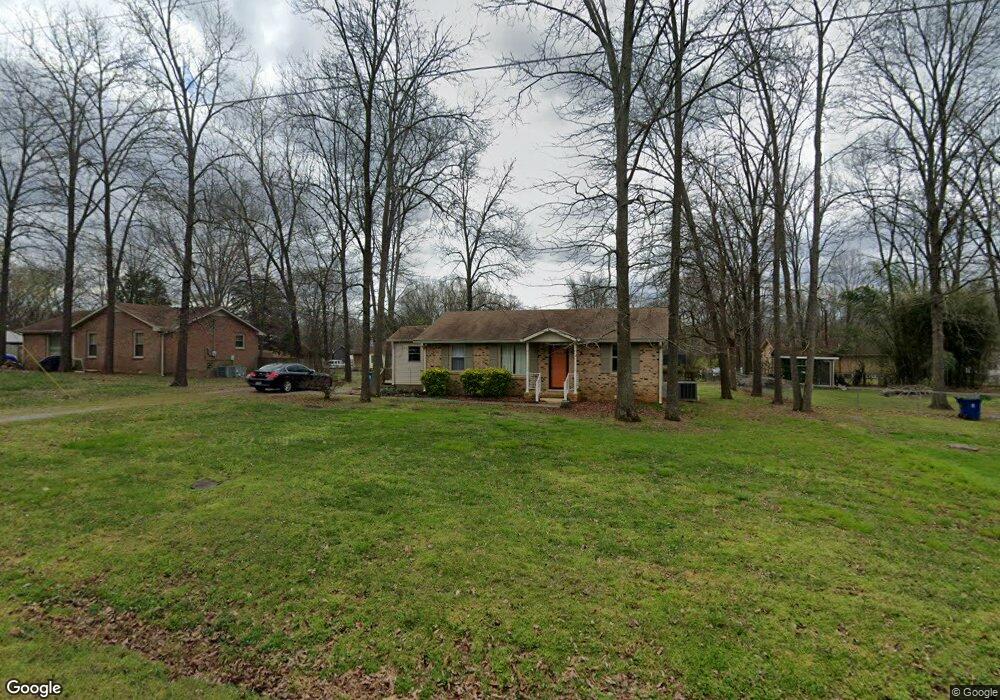
758 Buford St Smyrna, TN 37167
Estimated Value: $240,571 - $326,000
--
Bed
1
Bath
1,000
Sq Ft
$280/Sq Ft
Est. Value
About This Home
This home is located at 758 Buford St, Smyrna, TN 37167 and is currently estimated at $280,393, approximately $280 per square foot. 758 Buford St is a home located in Rutherford County with nearby schools including Stewartsboro Elementary School, Stewarts Creek Middle School, and Stewarts Creek High School.
Ownership History
Date
Name
Owned For
Owner Type
Purchase Details
Closed on
Nov 4, 2022
Sold by
Harris D Peyton And Patricia R Peyton Re
Bought by
Wilson Allison Ann and Wilson Angela Michele
Current Estimated Value
Purchase Details
Closed on
Dec 13, 2002
Sold by
Peyton Harris D and Peyton Patricia
Bought by
Peyton Revocable Trust
Purchase Details
Closed on
Sep 6, 2002
Sold by
Peyton Harris & Patricia Tr
Bought by
Peyton Harris D and Peyton Patricia
Purchase Details
Closed on
May 9, 2000
Sold by
Peyton Harris D
Bought by
Peyton Rev Living Trust
Purchase Details
Closed on
Sep 22, 1999
Sold by
Cook Robert G
Bought by
Payton Harris D
Home Financials for this Owner
Home Financials are based on the most recent Mortgage that was taken out on this home.
Original Mortgage
$71,900
Interest Rate
7.89%
Purchase Details
Closed on
Sep 27, 1994
Sold by
Moore Leonard D
Bought by
Cook Robert G
Create a Home Valuation Report for This Property
The Home Valuation Report is an in-depth analysis detailing your home's value as well as a comparison with similar homes in the area
Home Values in the Area
Average Home Value in this Area
Purchase History
| Date | Buyer | Sale Price | Title Company |
|---|---|---|---|
| Wilson Allison Ann | -- | -- | |
| Harris D Peyton And Patricia R Peyton Revocab | -- | -- | |
| Peyton Revocable Trust | -- | -- | |
| Peyton Harris D | -- | -- | |
| Peyton Rev Living Trust | -- | -- | |
| Payton Harris D | $79,900 | -- | |
| Cook Robert G | -- | -- |
Source: Public Records
Mortgage History
| Date | Status | Borrower | Loan Amount |
|---|---|---|---|
| Previous Owner | Cook Robert G | $71,900 |
Source: Public Records
Tax History Compared to Growth
Tax History
| Year | Tax Paid | Tax Assessment Tax Assessment Total Assessment is a certain percentage of the fair market value that is determined by local assessors to be the total taxable value of land and additions on the property. | Land | Improvement |
|---|---|---|---|---|
| 2025 | -- | $52,225 | $13,750 | $38,475 |
| 2024 | -- | $52,225 | $13,750 | $38,475 |
| 2023 | $980 | $52,225 | $13,750 | $38,475 |
| 2022 | $844 | $52,225 | $13,750 | $38,475 |
| 2021 | $727 | $32,775 | $7,000 | $25,775 |
| 2020 | $727 | $32,775 | $7,000 | $25,775 |
| 2019 | $727 | $32,775 | $7,000 | $25,775 |
| 2018 | $688 | $32,775 | $0 | $0 |
| 2017 | $598 | $22,325 | $0 | $0 |
| 2016 | $598 | $22,325 | $0 | $0 |
| 2015 | $598 | $22,325 | $0 | $0 |
| 2014 | $555 | $22,325 | $0 | $0 |
| 2013 | -- | $21,400 | $0 | $0 |
Source: Public Records
Map
Nearby Homes
- 408 Wheeler Ave
- 670 Baker Rd
- 630 Baker Rd
- 421 Hardee Ave
- 0 Old Nashville Hwy
- 2 Old Nashville Hwy
- 3000 Everley Ct
- 1023 Avery Park Dr
- 0 Baker Rd
- 595 Glenwood Ave
- 226 Hamburg Rd
- 2110 Alteras Dr
- 320 Longhorn Dr
- 212 Eusa Cantrell Ln
- 1214 Emmie Reece Dr
- 304 Belgian Ln
- 712 Stewart Valley Dr
- 801 Becham Kenneth Cir
- 374 Longhorn Dr
- 10510 Old Nashville Hwy