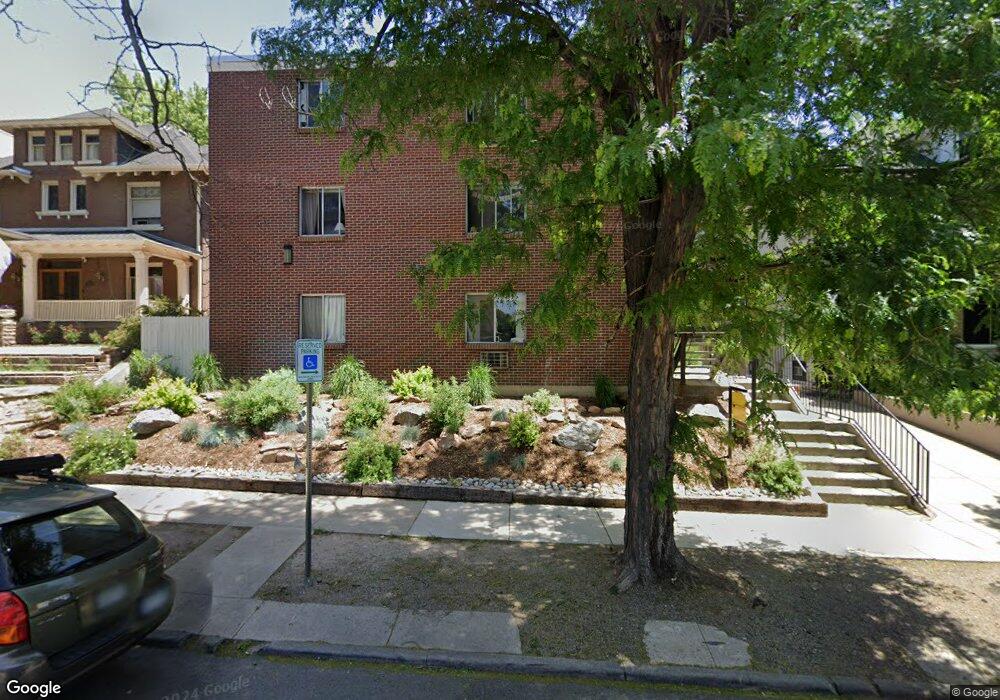
758 Clarkson St Denver, CO 80218
Capitol Hill Neighborhood
1
Bed
--
Bath
495
Sq Ft
--
Built
About This Home
This home is located at 758 Clarkson St, Denver, CO 80218. 758 Clarkson St is a home located in Denver County with nearby schools including Dora Moore ECE-8 School, Morey Middle School, and East High School.
Create a Home Valuation Report for This Property
The Home Valuation Report is an in-depth analysis detailing your home's value as well as a comparison with similar homes in the area
Home Values in the Area
Average Home Value in this Area
Property History
| Date | Event | Price | List to Sale | Price per Sq Ft |
|---|---|---|---|---|
| 02/04/2025 02/04/25 | Off Market | $1,375 | -- | -- |
| 01/23/2025 01/23/25 | Price Changed | $1,375 | -5.5% | $3 / Sq Ft |
| 01/13/2025 01/13/25 | Price Changed | $1,455 | +8.2% | $3 / Sq Ft |
| 01/07/2025 01/07/25 | Price Changed | $1,345 | 0.0% | $3 / Sq Ft |
| 01/07/2025 01/07/25 | For Rent | $1,345 | -17.2% | -- |
| 07/28/2022 07/28/22 | Price Changed | $1,625 | -1.5% | $3 / Sq Ft |
| 07/13/2022 07/13/22 | Price Changed | $1,650 | -1.5% | $3 / Sq Ft |
| 07/07/2022 07/07/22 | Price Changed | $1,675 | +5.0% | $3 / Sq Ft |
| 07/01/2022 07/01/22 | Price Changed | $1,595 | -5.9% | $3 / Sq Ft |
| 06/23/2022 06/23/22 | Price Changed | $1,695 | -3.1% | $3 / Sq Ft |
| 06/10/2022 06/10/22 | Price Changed | $1,750 | +4.2% | $4 / Sq Ft |
| 06/08/2022 06/08/22 | Price Changed | $1,680 | +6.7% | $3 / Sq Ft |
| 06/07/2022 06/07/22 | For Rent | -- | -- | -- |
| 05/29/2022 05/29/22 | Price Changed | $1,575 | +3.3% | $3 / Sq Ft |
| 05/27/2022 05/27/22 | Price Changed | $1,525 | -6.2% | $3 / Sq Ft |
| 05/22/2022 05/22/22 | Price Changed | $1,625 | -1.5% | $3 / Sq Ft |
| 05/20/2022 05/20/22 | Price Changed | $1,650 | +4.8% | $3 / Sq Ft |
| 05/18/2022 05/18/22 | For Rent | $1,575 | -- | -- |
Tax History
| Year | Tax Paid | Tax Assessment Tax Assessment Total Assessment is a certain percentage of the fair market value that is determined by local assessors to be the total taxable value of land and additions on the property. | Land | Improvement |
|---|---|---|---|---|
| 2025 | $19,671 | $334,870 | $24,840 | $24,840 |
| 2024 | $19,671 | $248,370 | $19,930 | $228,440 |
| 2023 | $19,245 | $248,370 | $19,930 | $228,440 |
| 2022 | $16,171 | $203,340 | $23,960 | $179,380 |
| 2021 | $15,954 | $213,810 | $25,200 | $188,610 |
| 2020 | $17,028 | $229,500 | $25,200 | $204,300 |
| 2019 | $16,551 | $229,500 | $25,200 | $204,300 |
| 2018 | $13,825 | $178,700 | $25,370 | $153,330 |
| 2017 | $13,784 | $178,700 | $25,370 | $153,330 |
| 2016 | $12,406 | $152,130 | $21,038 | $131,092 |
| 2015 | $11,885 | $174,140 | $21,038 | $153,102 |
| 2014 | $7,699 | $92,700 | $18,595 | $74,105 |
Source: Public Records
Map
Nearby Homes
- 805 E 7th Ave Unit 8
- 790 N Washington St Unit 1203
- 790 N Washington St Unit 1502
- 790 N Washington St Unit 305
- 790 N Washington St Unit 1210
- 790 N Washington St Unit 706
- 700 N Washington St Unit 502
- 800 N Washington St Unit 307
- 800 N Washington St Unit 210
- 800 N Washington St Unit 409
- 777 N Washington St Unit 508
- 777 N Washington St Unit 204
- 777 N Washington St Unit 201
- 685 N Emerson St
- 680 N Clarkson St
- 854 N Clarkson St
- 680 Emerson St
- 740 N Pearl St Unit 503
- 768 N Ogden St Unit 17
- 800 N Pearl St Unit 1211
- 758 N Clarkson St Unit 304
- 770 Clarkson St
- 790 N Clarkson St Unit 206
- 790 N Clarkson St Unit 205
- 740 Clarkson St
- 790 Clarkson St Unit 206
- 790 Clarkson St Unit 205
- 790 Clarkson St Unit 204
- 790 Clarkson St Unit 203
- 790 Clarkson St Unit 202
- 790 Clarkson St Unit 201
- 790 Clarkson St Unit 106
- 790 Clarkson St Unit 105
- 790 Clarkson St Unit 104
- 790 Clarkson St Unit 103
- 790 Clarkson St Unit 102
- 790 Clarkson St
- 790 Clarkson St Unit 101
- 765 Emerson St
- 745 N Emerson St
Your Personal Tour Guide
Ask me questions while you tour the home.