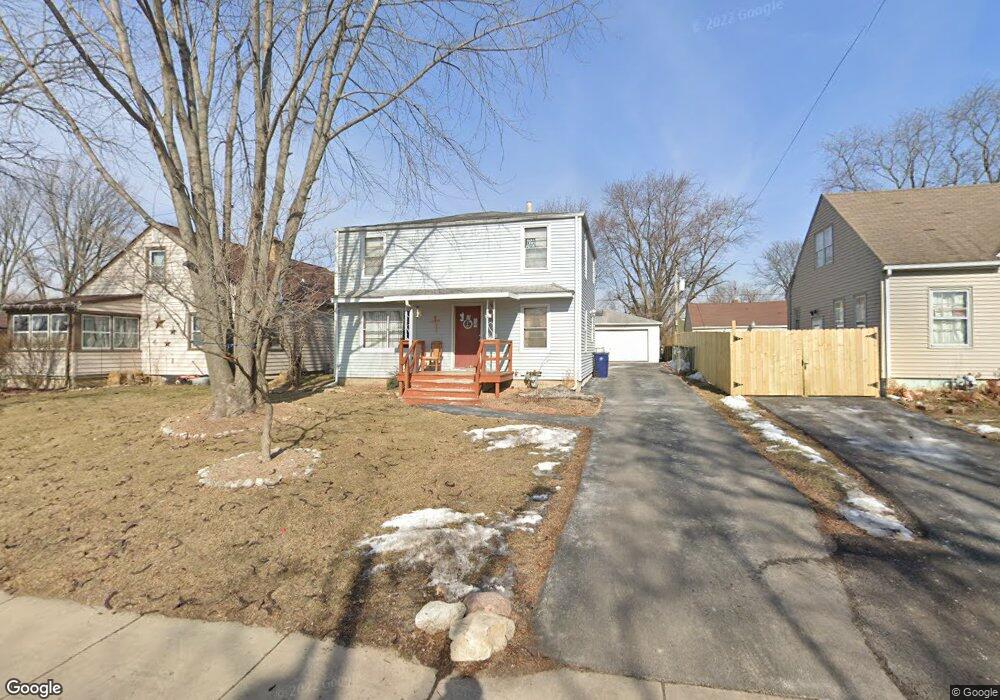
758 Hastings St Elgin, IL 60120
Southeast Elgin NeighborhoodEstimated Value: $267,000 - $297,000
4
Beds
3
Baths
1,300
Sq Ft
$219/Sq Ft
Est. Value
About This Home
This home is located at 758 Hastings St, Elgin, IL 60120 and is currently estimated at $284,248, approximately $218 per square foot. 758 Hastings St is a home located in Cook County with nearby schools including Huff Elementary School, Ellis Middle School, and Elgin High School.
Ownership History
Date
Name
Owned For
Owner Type
Purchase Details
Closed on
Jan 3, 2007
Sold by
Ramirez Maria E
Bought by
Lopez Veronica
Current Estimated Value
Home Financials for this Owner
Home Financials are based on the most recent Mortgage that was taken out on this home.
Original Mortgage
$209,900
Outstanding Balance
$125,436
Interest Rate
6.21%
Mortgage Type
Unknown
Estimated Equity
$158,812
Purchase Details
Closed on
Mar 29, 2005
Sold by
Garcia Olivia and Garcia Carlos
Bought by
Ramirez Maria E
Home Financials for this Owner
Home Financials are based on the most recent Mortgage that was taken out on this home.
Original Mortgage
$153,600
Interest Rate
7.6%
Mortgage Type
Unknown
Purchase Details
Closed on
Mar 28, 2002
Sold by
Phillips William and Phillips Charry M
Bought by
Garcia Olivia and Garcia Carlos
Home Financials for this Owner
Home Financials are based on the most recent Mortgage that was taken out on this home.
Original Mortgage
$155,558
Interest Rate
7.24%
Mortgage Type
FHA
Create a Home Valuation Report for This Property
The Home Valuation Report is an in-depth analysis detailing your home's value as well as a comparison with similar homes in the area
Home Values in the Area
Average Home Value in this Area
Purchase History
| Date | Buyer | Sale Price | Title Company |
|---|---|---|---|
| Lopez Veronica | $210,000 | Attorneys Title Guaranty Fun | |
| Ramirez Maria E | $192,000 | First American Title Ins Co | |
| Garcia Olivia | $158,000 | -- |
Source: Public Records
Mortgage History
| Date | Status | Borrower | Loan Amount |
|---|---|---|---|
| Open | Lopez Veronica | $209,900 | |
| Previous Owner | Ramirez Maria E | $153,600 | |
| Previous Owner | Garcia Olivia | $155,558 | |
| Closed | Ramirez Maria E | $38,400 |
Source: Public Records
Tax History Compared to Growth
Tax History
| Year | Tax Paid | Tax Assessment Tax Assessment Total Assessment is a certain percentage of the fair market value that is determined by local assessors to be the total taxable value of land and additions on the property. | Land | Improvement |
|---|---|---|---|---|
| 2024 | $4,515 | $19,000 | $2,285 | $16,715 |
| 2023 | $4,358 | $19,000 | $2,285 | $16,715 |
| 2022 | $4,358 | $19,000 | $2,285 | $16,715 |
| 2021 | $3,560 | $13,660 | $1,570 | $12,090 |
| 2020 | $3,615 | $13,660 | $1,570 | $12,090 |
| 2019 | $3,653 | $15,349 | $1,570 | $13,779 |
| 2018 | $3,642 | $14,155 | $1,428 | $12,727 |
| 2017 | $3,651 | $14,155 | $1,428 | $12,727 |
| 2016 | $4,129 | $15,454 | $1,428 | $14,026 |
| 2015 | $3,696 | $13,143 | $1,285 | $11,858 |
| 2014 | $3,598 | $13,143 | $1,285 | $11,858 |
| 2013 | $3,460 | $13,143 | $1,285 | $11,858 |
Source: Public Records
Map
Nearby Homes
- 645 Lavoie Ave
- 644 Lavoie Ave
- 628 S Liberty St
- 725 Dixon Ave
- 767 Dixon Ave
- 536 Aller Ave
- 539 Lucille Ave
- 653 Dixon Ave
- 653 Elgin Ave
- 445 Lucile Ave
- 661 Wellington Ave
- 603 Wellington Ave
- 364 Bent St
- 518 Raymond St
- 306 S Liberty St
- 1087 Houston Ave
- 262 Bartlett Place
- 1023 Berkshire Ct Unit C
- 1107 Yorkshire Ct Unit B
- 1104 Yorkshire Ct Unit B