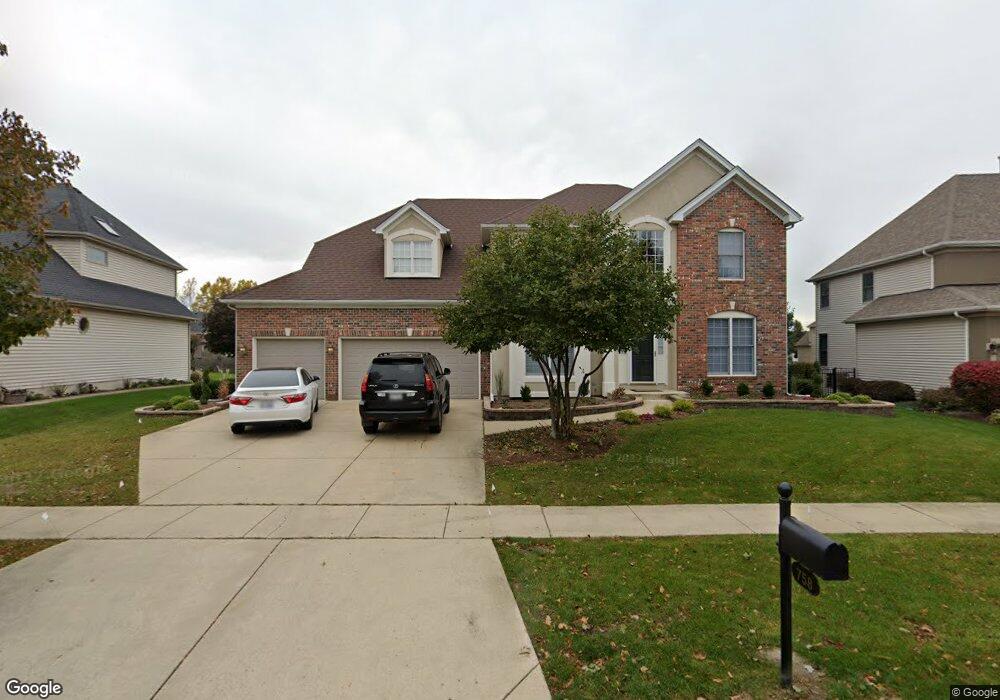
758 Kateland Way South Elgin, IL 60177
Thornwood NeighborhoodEstimated Value: $600,000 - $633,000
4
Beds
3
Baths
2,875
Sq Ft
$213/Sq Ft
Est. Value
About This Home
This home is located at 758 Kateland Way, South Elgin, IL 60177 and is currently estimated at $613,047, approximately $213 per square foot. 758 Kateland Way is a home located in Kane County with nearby schools including Corron Elementary School, Wredling Middle School, and St Charles North High School.
Ownership History
Date
Name
Owned For
Owner Type
Purchase Details
Closed on
Jun 5, 2017
Sold by
Hsbc Bank Usa National Association
Bought by
Tomma Leonard and Tomma Leeza
Current Estimated Value
Home Financials for this Owner
Home Financials are based on the most recent Mortgage that was taken out on this home.
Original Mortgage
$303,072
Outstanding Balance
$251,608
Interest Rate
3.95%
Mortgage Type
New Conventional
Estimated Equity
$361,439
Purchase Details
Closed on
Apr 5, 2016
Sold by
Cabrera Floro M
Bought by
Hsbc Bank Usa National Association
Purchase Details
Closed on
Jun 8, 2001
Sold by
Acorn Properties Corp
Bought by
Cabrera Floro M
Home Financials for this Owner
Home Financials are based on the most recent Mortgage that was taken out on this home.
Original Mortgage
$306,150
Interest Rate
7.16%
Create a Home Valuation Report for This Property
The Home Valuation Report is an in-depth analysis detailing your home's value as well as a comparison with similar homes in the area
Home Values in the Area
Average Home Value in this Area
Purchase History
| Date | Buyer | Sale Price | Title Company |
|---|---|---|---|
| Tomma Leonard | $219,500 | None Available | |
| Hsbc Bank Usa National Association | -- | Attorney | |
| Cabrera Floro M | $382,500 | Chicago Title Insurance Co |
Source: Public Records
Mortgage History
| Date | Status | Borrower | Loan Amount |
|---|---|---|---|
| Open | Tomma Leonard | $303,072 | |
| Previous Owner | Cabrera Floro M | $306,150 |
Source: Public Records
Tax History Compared to Growth
Tax History
| Year | Tax Paid | Tax Assessment Tax Assessment Total Assessment is a certain percentage of the fair market value that is determined by local assessors to be the total taxable value of land and additions on the property. | Land | Improvement |
|---|---|---|---|---|
| 2024 | $13,383 | $166,305 | $29,792 | $136,513 |
| 2023 | $12,863 | $148,845 | $26,664 | $122,181 |
| 2022 | $11,922 | $136,474 | $26,563 | $109,911 |
| 2021 | $11,476 | $130,087 | $25,320 | $104,767 |
| 2020 | $11,434 | $127,662 | $24,848 | $102,814 |
| 2019 | $11,266 | $125,134 | $24,356 | $100,778 |
| 2018 | $11,915 | $131,786 | $26,033 | $105,753 |
| 2017 | $11,390 | $127,280 | $25,143 | $102,137 |
| 2016 | $11,337 | $122,810 | $24,260 | $98,550 |
| 2015 | -- | $119,372 | $23,998 | $95,374 |
| 2014 | -- | $115,097 | $23,998 | $91,099 |
| 2013 | -- | $116,244 | $27,267 | $88,977 |
Source: Public Records
Map
Nearby Homes
- 731 Lake Ridge Dr
- 4 Persimmon Ln
- 1251 Lansbrook Dr
- 2159 Sutton Dr
- 852 Sunrise Dr
- 761 Reserve Ct
- 791 Reserve Ct
- 552 Waters Edge Dr
- 1987 Sagebrook Dr
- 675 Oak Ln
- 37W993 Heritage Oaks Dr
- 335 Forest Trail
- 7N949 Stevens Rd
- 280 Denton Ln
- 269 Nicole Dr Unit A
- 747 Heartland Ln
- 7N919 Cloverfield Rd
- 284 Nicole Dr Unit C
- 659 Glenwood Dr
- Lot 103 Oak Pointe Dr
- 752 Kateland Way
- 764 Kateland Way
- 801 W Thornwood Dr
- 803 W Thornwood Dr
- 793 W Thornwood Dr
- 746 Kateland Way
- 770 Kateland Way
- 785 W Thornwood Dr
- 765 Kateland Way
- 771 Kateland Way
- 759 Kateland Way
- 777 Kateland Way
- 807 W Thornwood Dr
- 776 Kateland Way
- 740 Kateland Way
- 777 W Thornwood Dr
- 809 W Thornwood Dr
- 753 Kateland Way
- 783 Kateland Way
- 769 W Thornwood Dr