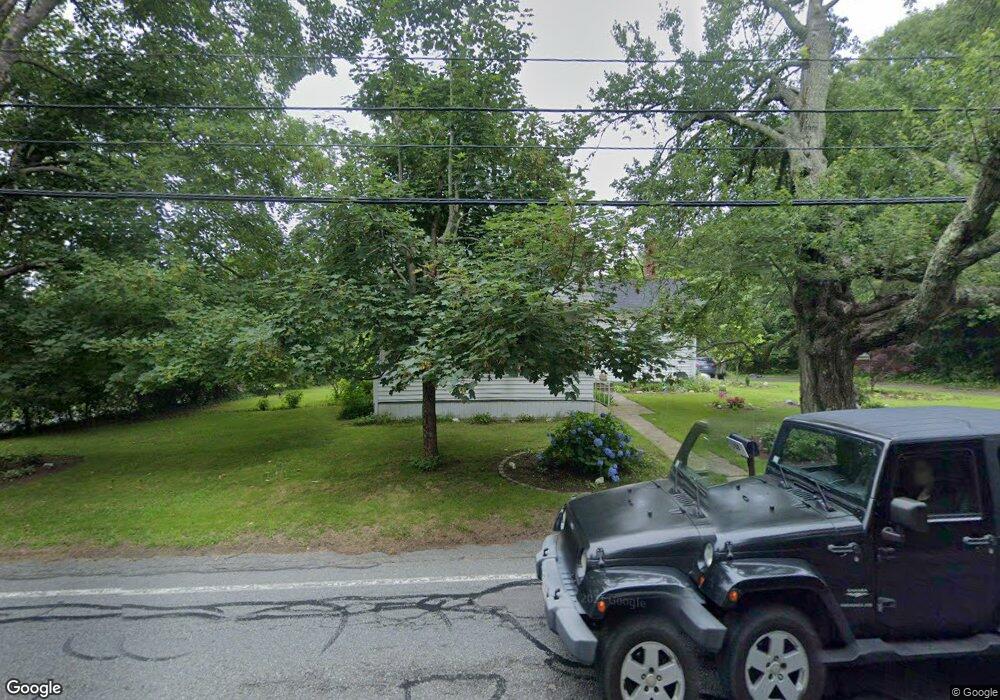
758 Main St Acushnet, MA 02743
Upper Acushnet NeighborhoodEstimated Value: $490,222 - $578,000
Studio
1
Bath
1,678
Sq Ft
$322/Sq Ft
Est. Value
About This Home
This home is located at 758 Main St, Acushnet, MA 02743 and is currently estimated at $540,056, approximately $321 per square foot. 758 Main St is a home located in Bristol County with nearby schools including Acushnet Elementary School, Albert F Ford Middle School, and St Francis Xavier Elementary School.
Ownership History
Date
Name
Owned For
Owner Type
Purchase Details
Closed on
Nov 8, 2021
Sold by
Chase-Corwin Jennifer
Bought by
Chase-Corwin Jennifer and Chase Heidi A
Current Estimated Value
Home Financials for this Owner
Home Financials are based on the most recent Mortgage that was taken out on this home.
Original Mortgage
$306,763
Outstanding Balance
$279,911
Interest Rate
2.99%
Mortgage Type
New Conventional
Estimated Equity
$260,145
Purchase Details
Closed on
Oct 19, 2016
Sold by
Esposito Christopher and Esposito Jennifer
Bought by
Chase Jennifer
Home Financials for this Owner
Home Financials are based on the most recent Mortgage that was taken out on this home.
Original Mortgage
$312,357
Interest Rate
3.75%
Mortgage Type
FHA
Purchase Details
Closed on
Nov 30, 2006
Sold by
Tomkiewicz Edwin
Bought by
Edwin Tomkiewicz Ret and Tomkiewicz Edwin
Create a Home Valuation Report for This Property
The Home Valuation Report is an in-depth analysis detailing your home's value as well as a comparison with similar homes in the area
Home Values in the Area
Average Home Value in this Area
Purchase History
| Date | Buyer | Sale Price | Title Company |
|---|---|---|---|
| Chase-Corwin Jennifer | -- | None Available | |
| Chase-Corwin Jennifer | -- | None Available | |
| Chase Jennifer | -- | -- | |
| Edwin Tomkiewicz Ret | -- | -- | |
| Chase Jennifer | -- | -- | |
| Edwin Tomkiewicz Ret | -- | -- |
Source: Public Records
Mortgage History
| Date | Status | Borrower | Loan Amount |
|---|---|---|---|
| Open | Chase-Corwin Jennifer | $306,763 | |
| Closed | Chase-Corwin Jennifer | $306,763 | |
| Previous Owner | Chase Jennifer | $312,357 |
Source: Public Records
Tax History
| Year | Tax Paid | Tax Assessment Tax Assessment Total Assessment is a certain percentage of the fair market value that is determined by local assessors to be the total taxable value of land and additions on the property. | Land | Improvement |
|---|---|---|---|---|
| 2025 | $39 | $365,700 | $172,700 | $193,000 |
| 2024 | $3,909 | $342,600 | $163,600 | $179,000 |
| 2023 | $3,904 | $325,300 | $148,500 | $176,800 |
| 2022 | $3,908 | $294,500 | $139,500 | $155,000 |
| 2021 | $3,760 | $271,900 | $139,500 | $132,400 |
| 2020 | $3,665 | $262,900 | $130,500 | $132,400 |
| 2019 | $3,515 | $247,900 | $124,500 | $123,400 |
| 2018 | $3,484 | $241,600 | $124,500 | $117,100 |
| 2017 | $3,425 | $237,200 | $124,500 | $112,700 |
| 2016 | $3,458 | $238,000 | $124,500 | $113,500 |
| 2015 | $3,180 | $222,700 | $124,500 | $98,200 |
Source: Public Records
Map
Nearby Homes
- 0 Land Way Unit 73479153
- 489 Main St
- 363 Main St
- 25 Pershing Ave
- 329 Middle Rd
- 191 Hathaway Rd
- 0 Keene Rd Unit 73459818
- 23 Oliveira Ave
- 134 Nyes Ln
- 7 Hamlin St
- 0 Hathaway Rd Unit 73469544
- 12 White St
- 23 Coury Dr
- 199 Quaker Ln
- 1015 Forbes St
- 168 Keene Rd
- 224 North St
- 973 Pembroke St
- 40 Foley Dr
- ES Acushnet Ave
Your Personal Tour Guide
Ask me questions while you tour the home.