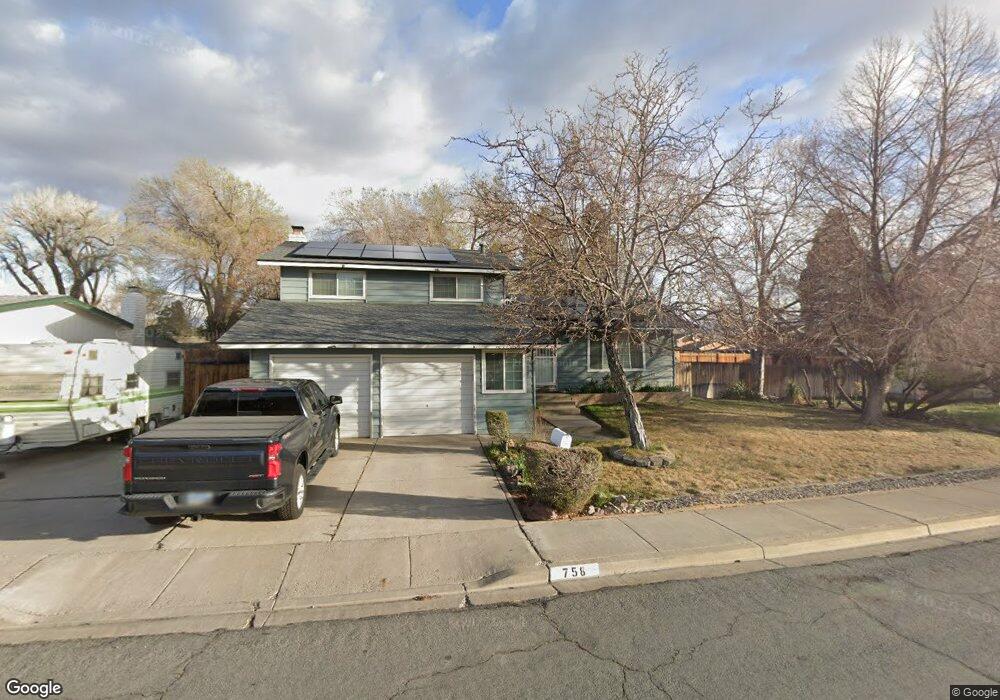
758 O Callaghan Dr Sparks, NV 89434
O'Callaghan NeighborhoodEstimated Value: $447,000 - $498,000
3
Beds
2
Baths
1,536
Sq Ft
$307/Sq Ft
Est. Value
About This Home
This home is located at 758 O Callaghan Dr, Sparks, NV 89434 and is currently estimated at $471,140, approximately $306 per square foot. 758 O Callaghan Dr is a home located in Washoe County with nearby schools including Katherine Dunn Elementary School, George L Dilworth Middle School, and Edward C Reed High School.
Ownership History
Date
Name
Owned For
Owner Type
Purchase Details
Closed on
Apr 27, 2005
Sold by
Cash Christy J
Bought by
Cash Kevin J
Current Estimated Value
Home Financials for this Owner
Home Financials are based on the most recent Mortgage that was taken out on this home.
Original Mortgage
$244,000
Outstanding Balance
$86,741
Interest Rate
1%
Mortgage Type
Negative Amortization
Estimated Equity
$384,399
Purchase Details
Closed on
May 30, 2000
Sold by
Taylor Scott E and Taylor Dana D
Bought by
Day Timothy W and Day Sara J
Home Financials for this Owner
Home Financials are based on the most recent Mortgage that was taken out on this home.
Original Mortgage
$139,060
Interest Rate
8.08%
Mortgage Type
FHA
Create a Home Valuation Report for This Property
The Home Valuation Report is an in-depth analysis detailing your home's value as well as a comparison with similar homes in the area
Home Values in the Area
Average Home Value in this Area
Purchase History
| Date | Buyer | Sale Price | Title Company |
|---|---|---|---|
| Cash Kevin J | -- | Ticor Title Of Nevada Inc | |
| Cash Kevin J | $305,000 | Ticor Title Of Nevada Inc | |
| Day Timothy W | $140,000 | Founders Title Co |
Source: Public Records
Mortgage History
| Date | Status | Borrower | Loan Amount |
|---|---|---|---|
| Open | Cash Kevin J | $244,000 | |
| Previous Owner | Day Timothy W | $139,060 | |
| Closed | Cash Kevin J | $30,500 |
Source: Public Records
Tax History Compared to Growth
Tax History
| Year | Tax Paid | Tax Assessment Tax Assessment Total Assessment is a certain percentage of the fair market value that is determined by local assessors to be the total taxable value of land and additions on the property. | Land | Improvement |
|---|---|---|---|---|
| 2025 | $1,543 | $65,371 | $39,139 | $26,233 |
| 2024 | $1,543 | $61,614 | $34,251 | $27,363 |
| 2023 | $1,080 | $59,921 | $33,296 | $26,625 |
| 2022 | $1,456 | $51,646 | $28,849 | $22,797 |
| 2021 | $1,415 | $45,528 | $22,234 | $23,294 |
| 2020 | $1,369 | $45,463 | $21,536 | $23,927 |
| 2019 | $1,329 | $43,509 | $19,808 | $23,701 |
| 2018 | $1,290 | $37,549 | $14,075 | $23,474 |
| 2017 | $1,252 | $37,456 | $13,451 | $24,005 |
| 2016 | $1,226 | $37,836 | $12,973 | $24,863 |
| 2015 | $1,220 | $35,830 | $10,180 | $25,650 |
| 2014 | $1,165 | $33,544 | $8,857 | $24,687 |
| 2013 | -- | $31,082 | $6,358 | $24,724 |
Source: Public Records
Map
Nearby Homes
- 949 Crestwood Dr Unit 3
- 848 Parkside Dr Unit 1
- 801 Woodglen Dr Unit 2
- 857 Cherry Tree Dr Unit 3
- 385 Gleeson Way
- 370 O'Brien Way
- 684 Oakwood Dr Unit 3
- 907 Camino Real Dr
- 1897 Bonita Vista Dr
- 644 Oakwood Dr Unit 2
- 1973 Rio Tinto Dr
- 1218 Junction Dr
- 611 Oakwood Dr Unit 1
- 604 Oakwood Dr Unit 1
- 601 Oakwood Dr Unit 4
- 675 Parlanti Ln Unit 52
- 675 Parlanti Ln Unit 124
- 675 Parlanti Ln Unit 42
- 675 Parlanti Ln
- 675 Parlanti Ln Unit 88
- 738 O Callaghan Dr
- 778 O'Callaghan Dr
- 778 O Callaghan Dr
- 728 O Callaghan Dr
- 728 O'Callaghan Dr
- 1235 Howard Dr
- 798 O Callaghan Dr
- 753 O Callaghan Dr
- 733 O Callaghan Dr
- 773 O Callaghan Dr
- 713 O'Callaghan Dr
- 793 O Callaghan Dr
- 1300 N Mccarran Blvd
- 723 O Callaghan Dr
- 1255 Howard Dr
- 713 O Callaghan Dr Unit 7
- 708 O Callaghan Dr
- 1185 Howard Dr
- 700 O'Callaghan Dr
- 1285 Howard Dr