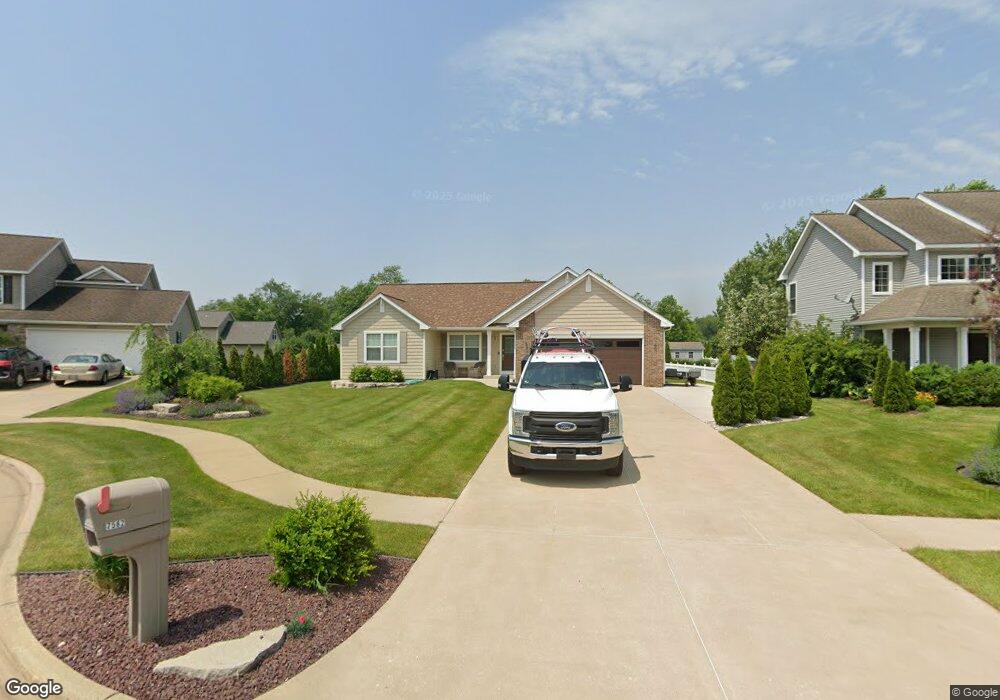
7582 Bali Ct Portage, MI 49002
Estimated Value: $302,000 - $358,000
3
Beds
2
Baths
1,426
Sq Ft
$227/Sq Ft
Est. Value
About This Home
This home is located at 7582 Bali Ct, Portage, MI 49002 and is currently estimated at $323,375, approximately $226 per square foot. 7582 Bali Ct is a home located in Kalamazoo County with nearby schools including Lake Center Elementary School, Portage Central Middle School, and Portage Central High School.
Ownership History
Date
Name
Owned For
Owner Type
Purchase Details
Closed on
Jan 26, 2023
Sold by
Kreiner Makenzie
Bought by
Rogers Scott
Current Estimated Value
Home Financials for this Owner
Home Financials are based on the most recent Mortgage that was taken out on this home.
Original Mortgage
$165,000
Outstanding Balance
$153,395
Interest Rate
6.27%
Mortgage Type
New Conventional
Estimated Equity
$169,980
Purchase Details
Closed on
Jul 2, 2008
Sold by
Bisnett Adam T and Bisnett Harmony M
Bought by
Rogers Scott and Kreiner Makenzie
Home Financials for this Owner
Home Financials are based on the most recent Mortgage that was taken out on this home.
Original Mortgage
$172,296
Interest Rate
6.51%
Mortgage Type
FHA
Purchase Details
Closed on
May 26, 2005
Sold by
Wtm Inc
Bought by
Bisnett Adam T and Holmes Harmony M
Home Financials for this Owner
Home Financials are based on the most recent Mortgage that was taken out on this home.
Original Mortgage
$146,560
Interest Rate
5.5%
Mortgage Type
Fannie Mae Freddie Mac
Create a Home Valuation Report for This Property
The Home Valuation Report is an in-depth analysis detailing your home's value as well as a comparison with similar homes in the area
Home Values in the Area
Average Home Value in this Area
Purchase History
| Date | Buyer | Sale Price | Title Company |
|---|---|---|---|
| Rogers Scott | -- | -- | |
| Rogers Scott | $175,000 | Chicago Title | |
| Bisnett Adam T | $183,200 | Chicago Title |
Source: Public Records
Mortgage History
| Date | Status | Borrower | Loan Amount |
|---|---|---|---|
| Open | Rogers Scott | $165,000 | |
| Previous Owner | Rogers Scott | $172,296 | |
| Previous Owner | Bisnett Adam T | $146,560 |
Source: Public Records
Tax History Compared to Growth
Tax History
| Year | Tax Paid | Tax Assessment Tax Assessment Total Assessment is a certain percentage of the fair market value that is determined by local assessors to be the total taxable value of land and additions on the property. | Land | Improvement |
|---|---|---|---|---|
| 2025 | $4,811 | $142,300 | $0 | $0 |
| 2024 | $4,236 | $140,800 | $0 | $0 |
| 2023 | $4,038 | $124,300 | $0 | $0 |
| 2022 | $4,351 | $112,900 | $0 | $0 |
| 2021 | $4,208 | $109,000 | $0 | $0 |
| 2020 | $4,118 | $101,800 | $0 | $0 |
| 2019 | $431 | $94,700 | $0 | $0 |
| 2018 | $0 | $86,400 | $0 | $0 |
| 2017 | $0 | $86,100 | $0 | $0 |
| 2016 | -- | $89,400 | $0 | $0 |
| 2015 | -- | $88,600 | $0 | $0 |
| 2014 | -- | $84,700 | $0 | $0 |
Source: Public Records
Map
Nearby Homes
- 7261 Heartwood Ct
- 7626 Autumn St
- 7216 Heartwood Ct
- 5134 Deep Point Dr
- 5188 Deep Point Dr
- 8811 Waruf Ave
- 4127 Hayes St
- 3730 E Shore Dr
- 3308 E Shore Dr
- 9048 Long Lake Dr E
- 2918 E Shore Dr
- 6710 Portage Rd
- 5931 Belard St
- 8425 Oakside St
- 9340 Sassafras Trail
- 7132 27th St S
- 4485 Branch Ave
- 9421 Sassafras Trail Unit 76
- 1806 Pleasant Dr
- 6189 Clovermeadows Ave