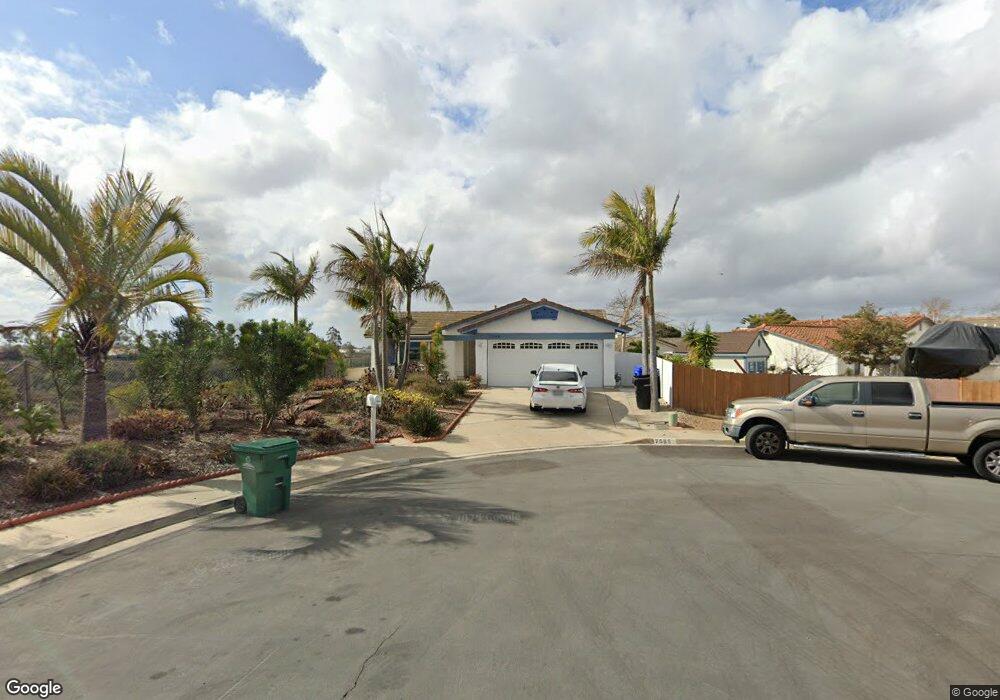
7585 Darden Ct San Diego, CA 92126
Mira Mesa NeighborhoodEstimated Value: $1,066,763 - $1,133,000
4
Beds
2
Baths
1,366
Sq Ft
$804/Sq Ft
Est. Value
About This Home
This home is located at 7585 Darden Ct, San Diego, CA 92126 and is currently estimated at $1,098,691, approximately $804 per square foot. 7585 Darden Ct is a home located in San Diego County with nearby schools including Jonas Salk Elementary School, Challenger Middle School, and Mira Mesa High School.
Ownership History
Date
Name
Owned For
Owner Type
Purchase Details
Closed on
Oct 4, 2012
Sold by
Kim Chong W and Kim Chan W
Bought by
Kim Chong W and Kim Chan W
Current Estimated Value
Home Financials for this Owner
Home Financials are based on the most recent Mortgage that was taken out on this home.
Original Mortgage
$300,000
Outstanding Balance
$207,643
Interest Rate
3.5%
Mortgage Type
New Conventional
Estimated Equity
$891,048
Purchase Details
Closed on
Jun 15, 2011
Sold by
Kim Chong W and Kim Chan W
Bought by
Kim Chong W and Kim Chan W
Purchase Details
Closed on
Dec 9, 2010
Sold by
Vankhuu Ngoc and Lam Phuong
Bought by
Kim Chong W and Kim Chan W
Home Financials for this Owner
Home Financials are based on the most recent Mortgage that was taken out on this home.
Original Mortgage
$300,000
Interest Rate
4.43%
Mortgage Type
New Conventional
Purchase Details
Closed on
Aug 11, 2008
Sold by
Vankhuu Ngoc and Lam Phuong
Bought by
Vankhuu Ngoc and Lam Phuong My
Home Financials for this Owner
Home Financials are based on the most recent Mortgage that was taken out on this home.
Original Mortgage
$271,500
Interest Rate
6.32%
Mortgage Type
Stand Alone Refi Refinance Of Original Loan
Purchase Details
Closed on
Aug 6, 2008
Sold by
Vanvankhuu Ngoc Van
Bought by
Vanvankhuu Ngoc Van and Lam Phuong
Home Financials for this Owner
Home Financials are based on the most recent Mortgage that was taken out on this home.
Original Mortgage
$271,500
Interest Rate
6.32%
Mortgage Type
Stand Alone Refi Refinance Of Original Loan
Purchase Details
Closed on
Jul 30, 2003
Sold by
Lam Phuong My
Bought by
Vanvankhuu Ngoc Van
Home Financials for this Owner
Home Financials are based on the most recent Mortgage that was taken out on this home.
Original Mortgage
$290,000
Interest Rate
5.17%
Mortgage Type
Unknown
Purchase Details
Closed on
Jul 15, 2003
Sold by
Bleil Jeffrey David and Bleil Cristina Da Silva
Bought by
Ngoc Khuu
Home Financials for this Owner
Home Financials are based on the most recent Mortgage that was taken out on this home.
Original Mortgage
$290,000
Interest Rate
5.17%
Mortgage Type
Unknown
Purchase Details
Closed on
Jul 25, 1994
Sold by
Ladner Kevin J and Ladner Norma J
Bought by
Bleil Jeffrey David and Bleil Welma Cristina Dasilva
Home Financials for this Owner
Home Financials are based on the most recent Mortgage that was taken out on this home.
Original Mortgage
$169,100
Interest Rate
5.37%
Purchase Details
Closed on
Jun 1, 1987
Create a Home Valuation Report for This Property
The Home Valuation Report is an in-depth analysis detailing your home's value as well as a comparison with similar homes in the area
Home Values in the Area
Average Home Value in this Area
Purchase History
| Date | Buyer | Sale Price | Title Company |
|---|---|---|---|
| Kim Chong W | -- | Servicelink | |
| Kim Chong W | -- | Servicelink | |
| Kim Chong W | -- | None Available | |
| Kim Chong W | $405,000 | First American Title Company | |
| Vankhuu Ngoc | -- | Nations Title Of California | |
| Vanvankhuu Ngoc Van | -- | Nations Title Of California | |
| Vanvankhuu Ngoc Van | -- | United Title Company | |
| Ngoc Khuu | $410,000 | United Title Company | |
| Bleil Jeffrey David | $178,000 | Chicago Title Company | |
| -- | $131,500 | -- |
Source: Public Records
Mortgage History
| Date | Status | Borrower | Loan Amount |
|---|---|---|---|
| Open | Kim Chong W | $300,000 | |
| Previous Owner | Kim Chong W | $300,000 | |
| Previous Owner | Vanvankhuu Ngoc Van | $271,500 | |
| Previous Owner | Ngoc Khuu | $290,000 | |
| Previous Owner | Bleil Jeffrey David | $169,100 |
Source: Public Records
Tax History Compared to Growth
Tax History
| Year | Tax Paid | Tax Assessment Tax Assessment Total Assessment is a certain percentage of the fair market value that is determined by local assessors to be the total taxable value of land and additions on the property. | Land | Improvement |
|---|---|---|---|---|
| 2025 | $6,300 | $518,860 | $372,518 | $146,342 |
| 2024 | $6,300 | $508,687 | $365,214 | $143,473 |
| 2023 | $6,160 | $498,713 | $358,053 | $140,660 |
| 2022 | $5,996 | $488,935 | $351,033 | $137,902 |
| 2021 | $5,954 | $479,349 | $344,150 | $135,199 |
| 2020 | $5,882 | $474,435 | $340,622 | $133,813 |
| 2019 | $5,777 | $465,134 | $333,944 | $131,190 |
| 2018 | $5,403 | $456,015 | $327,397 | $128,618 |
| 2017 | $5,271 | $447,075 | $320,978 | $126,097 |
| 2016 | $5,187 | $438,310 | $314,685 | $123,625 |
| 2015 | $5,111 | $431,728 | $309,959 | $121,769 |
| 2014 | $5,031 | $423,272 | $303,888 | $119,384 |
Source: Public Records
Map
Nearby Homes
- 7506 Flanders Dr
- 7427 Kamwood St
- 10606 Aderman Ave Unit 5
- 10646 Aderman Ave Unit 21
- 10740 Aderman Ave Unit 66
- 10774 Dabney Dr Unit 20
- 10668 Dabney Dr Unit 122
- 10668 Dabney Dr Unit 125
- 11050 Solstice Way
- 10692 Dabney Dr Unit 102
- 7857 Embry Point
- 8177 Rose Quartz Cir
- 8246 Rose Quartz Cir
- 8021 Rubicon Way
- 10422 Adamson Way
- 10561 Coupland Way
- 10785 Chinon Cir
- 7971 Jade Coast Rd
- Plan 3 at Meadows District at 3Roots - Atwood at 3Roots
- Plan 4 at Meadows District at 3Roots - Atwood at 3Roots
- 10357 Darden Rd
- 10353 Darden Rd
- 10363 Darden Rd
- 10347 Darden Rd
- 7590 Darden Ct
- 7580 Darden Ct
- 10343 Darden Rd
- 7570 Darden Ct
- 10373 Darden Rd
- 10366 Darden Rd
- 10372 Darden Rd
- 10354 Darden Rd
- 10339 Darden Rd
- 10380 Darden Rd
- 10346 Darden Rd
- 10383 Darden Rd
- 10333 Darden Rd
- 10340 Darden Rd
- 10365 Cheviot Ct
- 10386 Darden Rd