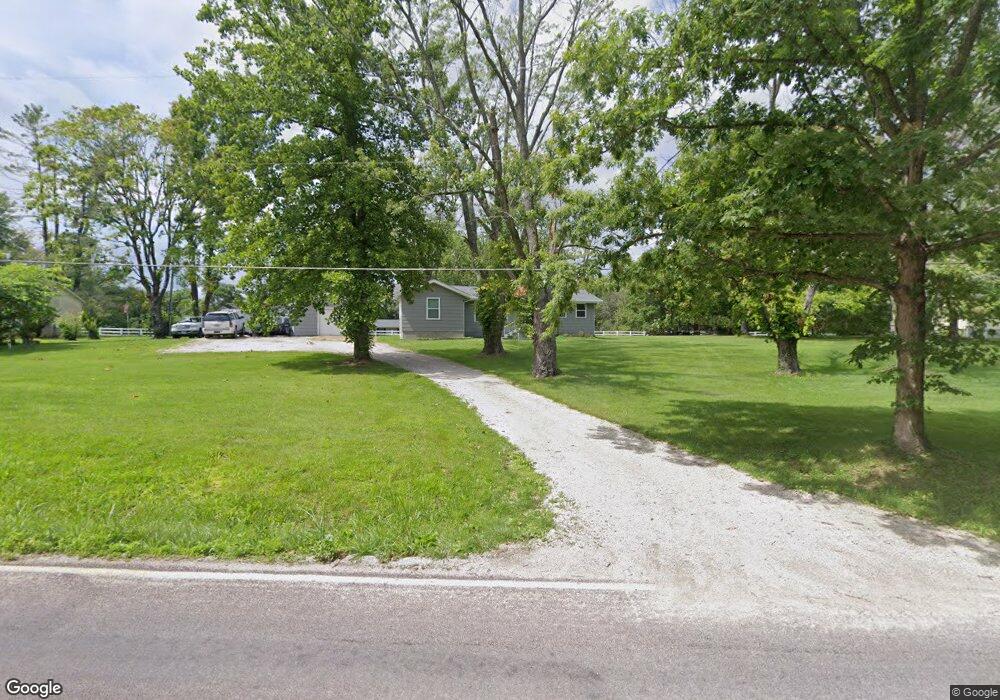
7586 Local Hillsboro Rd Cedar Hill, MO 63016
Estimated Value: $214,685 - $255,000
--
Bed
--
Bath
1,287
Sq Ft
$179/Sq Ft
Est. Value
About This Home
This home is located at 7586 Local Hillsboro Rd, Cedar Hill, MO 63016 and is currently estimated at $229,921, approximately $178 per square foot. 7586 Local Hillsboro Rd is a home located in Jefferson County with nearby schools including Hillsboro Primary School, Hillsboro Elementary School, and Hillsboro Middle Elementary School.
Ownership History
Date
Name
Owned For
Owner Type
Purchase Details
Closed on
Mar 31, 2016
Sold by
Schultz Jesse A and Govro Sara M
Bought by
Schultz Jesse A
Current Estimated Value
Home Financials for this Owner
Home Financials are based on the most recent Mortgage that was taken out on this home.
Original Mortgage
$76,800
Outstanding Balance
$60,892
Interest Rate
3.62%
Mortgage Type
New Conventional
Estimated Equity
$169,029
Purchase Details
Closed on
Oct 23, 2003
Sold by
Stock Shirley I
Bought by
Schultz Jesse A and Govro Sara M
Home Financials for this Owner
Home Financials are based on the most recent Mortgage that was taken out on this home.
Original Mortgage
$86,147
Interest Rate
6.1%
Mortgage Type
FHA
Purchase Details
Closed on
Jul 3, 2003
Sold by
Furrer Donald J and Furrer Kellie A
Bought by
Jensen Richard L and Jensen Jodi A
Purchase Details
Closed on
Jun 30, 2003
Sold by
Stock Dennis A
Bought by
Stock Shirley I and Stock George W
Create a Home Valuation Report for This Property
The Home Valuation Report is an in-depth analysis detailing your home's value as well as a comparison with similar homes in the area
Home Values in the Area
Average Home Value in this Area
Purchase History
| Date | Buyer | Sale Price | Title Company |
|---|---|---|---|
| Schultz Jesse A | -- | Fidelity National Title Rlc | |
| Schultz Jesse A | -- | Capital Title Co Inc | |
| Jensen Richard L | -- | -- | |
| Stock Shirley I | -- | -- |
Source: Public Records
Mortgage History
| Date | Status | Borrower | Loan Amount |
|---|---|---|---|
| Open | Schultz Jesse A | $76,800 | |
| Closed | Schultz Jesse A | $86,147 |
Source: Public Records
Tax History Compared to Growth
Tax History
| Year | Tax Paid | Tax Assessment Tax Assessment Total Assessment is a certain percentage of the fair market value that is determined by local assessors to be the total taxable value of land and additions on the property. | Land | Improvement |
|---|---|---|---|---|
| 2025 | $1,105 | $18,600 | $1,800 | $16,800 |
| 2024 | $1,105 | $16,400 | $1,800 | $14,600 |
| 2023 | $1,105 | $16,400 | $1,800 | $14,600 |
| 2022 | $1,195 | $16,400 | $1,800 | $14,600 |
| 2021 | $1,195 | $16,400 | $1,800 | $14,600 |
| 2020 | $1,095 | $14,500 | $1,400 | $13,100 |
| 2019 | $1,094 | $14,500 | $1,400 | $13,100 |
| 2018 | $1,093 | $14,500 | $1,400 | $13,100 |
| 2017 | $1,042 | $14,500 | $1,400 | $13,100 |
| 2016 | $967 | $13,300 | $1,600 | $11,700 |
| 2015 | -- | $13,300 | $1,600 | $11,700 |
Source: Public Records
Map
Nearby Homes
- 6517 Jenny Ct
- 6521 Jenny Ct
- 7648 Local Hillsboro Rd
- 6615 Jenny Ct
- 6521 Woodland Dr
- 6510 Deerwood Dr
- 7412 Oakwood Dr S
- 7304 Hillandale Dr
- 764 Red Clover Dr
- 6 Walnut Park Dr
- 524 Arrowhead Point
- 511 Arrowhead
- 6935 Timberline
- 0 Rosemary Ln
- 8438 High St
- 6701 Duckworth Ct
- 6012 Cedar Glen Dr
- 8600 High St
- 7049 Carriage Hills Meadows
- 8528 Red Rose Ct
- 6616 Davis Ln
- 6600 Davis Ln
- 6609 Davis Ln
- 7567 Local Hillsboro Rd
- 6688 Valley Dr
- 6601 Davis Ln
- 7624 Local Hillsboro Rd
- 7553 Local Hillsboro Rd
- 6533 Jenny Ct
- 7539 Local Hillsboro Rd
- 6663 Valley Dr
- 6541 Jenny Ct
- 7636 Local Hillsboro Rd
- 6532 Jenny Ct
- 6669 Valley Dr
- 7647 Local Hillsboro Rd
- 6551 Jenny Ct
- 6670 Jenny Ct
- 7525 Local Hillsboro Rd
- 6544 Jenny Ct