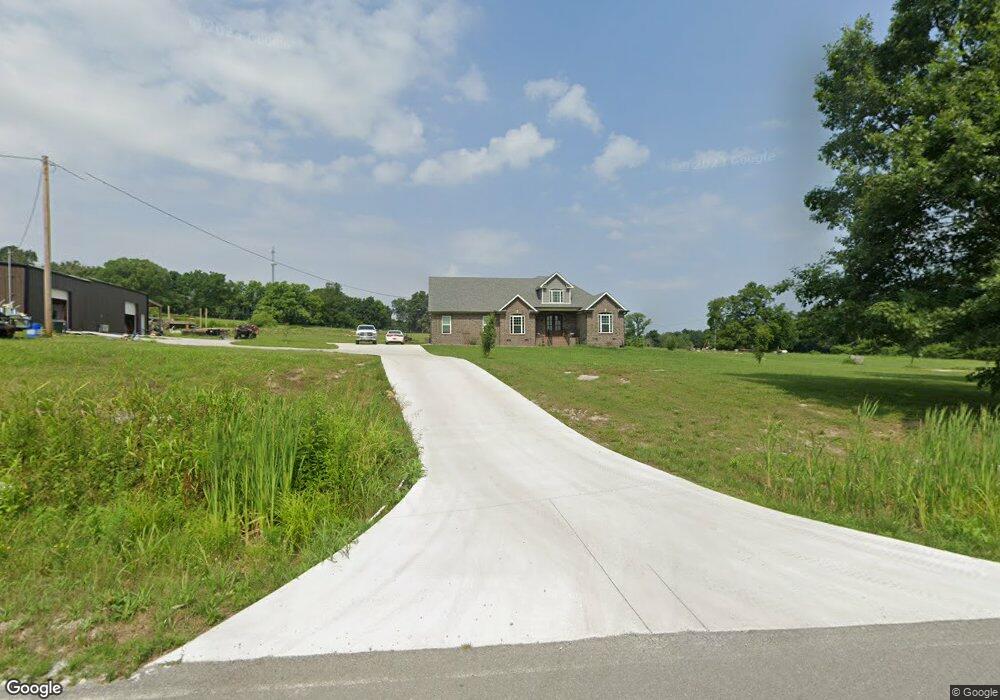
759 Knight Campground Rd Shelbyville, TN 37160
Estimated Value: $461,000 - $676,000
--
Bed
2
Baths
2,357
Sq Ft
$245/Sq Ft
Est. Value
About This Home
This home is located at 759 Knight Campground Rd, Shelbyville, TN 37160 and is currently estimated at $578,456, approximately $245 per square foot. 759 Knight Campground Rd is a home located in Bedford County with nearby schools including Liberty Elementary School.
Ownership History
Date
Name
Owned For
Owner Type
Purchase Details
Closed on
Apr 5, 2018
Sold by
Gary Boyce Construction Llc
Bought by
Smith Aubrey James
Current Estimated Value
Home Financials for this Owner
Home Financials are based on the most recent Mortgage that was taken out on this home.
Original Mortgage
$308,000
Outstanding Balance
$264,056
Interest Rate
4.4%
Mortgage Type
VA
Estimated Equity
$314,400
Purchase Details
Closed on
Mar 18, 2016
Sold by
Savage Harvey Kenneth
Bought by
Gary Boyce Construction Llc
Purchase Details
Closed on
Nov 29, 2007
Bought by
Savage Harvey Kenneth and Savage Mary Jane
Purchase Details
Closed on
Feb 6, 2007
Sold by
Grogan Johnny Gale
Bought by
Sullivan Dwayne
Purchase Details
Closed on
Apr 13, 2000
Sold by
Damron Jesse Lee
Bought by
Grogan Johnny G and Grogan Hae S
Purchase Details
Closed on
Feb 13, 1995
Sold by
Grogan William and Grogan Gladys
Bought by
Grogan Johnny and Grogan Hae
Purchase Details
Closed on
Jan 24, 1995
Bought by
Grogan William Leonard and Grogan Gladys Le
Create a Home Valuation Report for This Property
The Home Valuation Report is an in-depth analysis detailing your home's value as well as a comparison with similar homes in the area
Home Values in the Area
Average Home Value in this Area
Purchase History
| Date | Buyer | Sale Price | Title Company |
|---|---|---|---|
| Smith Aubrey James | $308,000 | Advantage Title & Escrow Inc | |
| Gary Boyce Construction Llc | $106,000 | -- | |
| Savage Harvey Kenneth | $185,800 | -- | |
| Sullivan Dwayne | $89,000 | -- | |
| Grogan Johnny G | -- | -- | |
| Grogan Johnny | $27,080 | -- | |
| Grogan William Leonard | $27,100 | -- |
Source: Public Records
Mortgage History
| Date | Status | Borrower | Loan Amount |
|---|---|---|---|
| Open | Smith Aubrey James | $308,000 |
Source: Public Records
Tax History Compared to Growth
Tax History
| Year | Tax Paid | Tax Assessment Tax Assessment Total Assessment is a certain percentage of the fair market value that is determined by local assessors to be the total taxable value of land and additions on the property. | Land | Improvement |
|---|---|---|---|---|
| 2025 | $2,308 | $99,275 | $0 | $0 |
| 2024 | $2,308 | $99,275 | $10,275 | $89,000 |
| 2023 | $2,308 | $99,275 | $10,275 | $89,000 |
| 2022 | $2,308 | $99,275 | $10,275 | $89,000 |
| 2021 | $1,771 | $90,125 | $10,275 | $79,850 |
| 2020 | $1,798 | $90,125 | $10,275 | $79,850 |
| 2019 | $1,798 | $67,600 | $11,075 | $56,525 |
| 2018 | $1,736 | $67,800 | $11,075 | $56,725 |
| 2017 | $289 | $11,275 | $11,075 | $200 |
| 2016 | $284 | $11,275 | $11,075 | $200 |
| 2015 | $284 | $11,275 | $11,075 | $200 |
| 2014 | $206 | $9,062 | $0 | $0 |
Source: Public Records
Map
Nearby Homes
- 0 Dixon Rd Unit RTC3045417
- 8 Farris Ln
- 0 Knight Campground Rd
- 3 Knight Campground Rd
- 321 Dixon Rd
- 7 Dixon Rd
- 12 Dixon Rd
- 395 Harrison Rd
- 422 Bethlehem Church Rd
- 388 Coble Rd
- 332 Coble Rd
- 163 Gant Rd
- 1617 Highway 130 W
- 1261 Highway 130 W
- 1106 Highway 130 W
- 143 Coble Rd
- 2028 Highway 64 W
- 0 Adams Hollow Rd
- 245 Henslee Rd
- 392 Adams Rd
- 141 Uselton Rd
- 105 Uselton Rd
- 749 Knight Campground Rd
- 745 Knight Campground Rd
- 750 Knight Campground Rd
- 151 Uselton Rd
- 733 Knight Campground Rd
- 161 Uselton Rd
- 169 Uselton Rd
- 171 Uselton Rd
- 168 Uselton Rd
- 876 Knight Campground Rd
- 0 Uselton Rd
- 199 Uselton Rd
- 200 Uselton Rd
- 895 Knight Campground Rd
- 1625 Highway 64 W
- 1625 Highway 64 W
- 1627 Highway 64 W
- 210 Uselton Rd